Written 12 September 2026. Every figure below was pulled this morning, company numbers straight out of SEC filings, prices from a market-data vendor by the developed script linked at the bottom.
I built a watchlist before I built a reason to have one. It lived in a note on my phone. Tickers went on it at the rate of about one per interesting evening, each arriving with a story attached and none of them ever leaving. There was no rule for getting on the list, and certainly none for getting any off it. If you’d asked me what the list was for, I’d have said “companies I want to research”, which sounds like a plan right up until you notice it’s a synonym for “companies I have heard of recently.”
That list was not a research pipeline, it was more, a record of my media diet with a currency symbol in front of it.
The question I wanted answered is the one everybody asks first, and it’s the wrong one: what should I buy? Not wrong because it’s greedy or naive. Wrong because it asks for the output of a machine nobody has built yet. A pick is a conclusion; a process is the argument that produced it. Take the conclusion without the argument, and you own something you can’t maintain, because you have no idea what would make it stop being true; which is, inconveniently, the only thing you’ll actually need to know.
I used to think a process was what you built after you got decent at picking, like some tidying-up phase, once the fun part was working … that’s backwards. The process is what makes picking possible at all, it is also the only thing that makes a bad pick survivable.
Here’s what convinced me, and it isn’t an argument, actually simple arithmetic.
Before anything else: a guess
Five tests, and that is the whole screen. Read them and notice how unambitious they are.
- The company made a profit in its most recent financial year.
- It made a profit in each of its five most recent financial years.
- Last year, its operating cash flow covered its capital spending.
- It sold more last year than it did five years earlier.
- Its diluted share count is no more than 10% higher than it was five years ago.
There is no judgement anywhere in that list. Nothing about moats, management, competitors, or even price. Every line is a floor rather than a standard, the kind of thing you’d assume was true of any company respectable enough to be listed on an exchange.
Now the guess. For the 2025 financial year, 5,625 companies filed an audited annual profit-or-loss figure with the SEC and of those, how many pass all five?
Write a number down before you scroll, when I first ran it, I guessed a third.
The answer is 622 and that is 11%.
And the cull starts immediately, at the least demanding test in the set: only 2,882 of those 5,625, 51% made any profit at all last year. Counted one company, one vote, just under half of everything filing annual accounts with the SEC lost money in its most recent financial year.
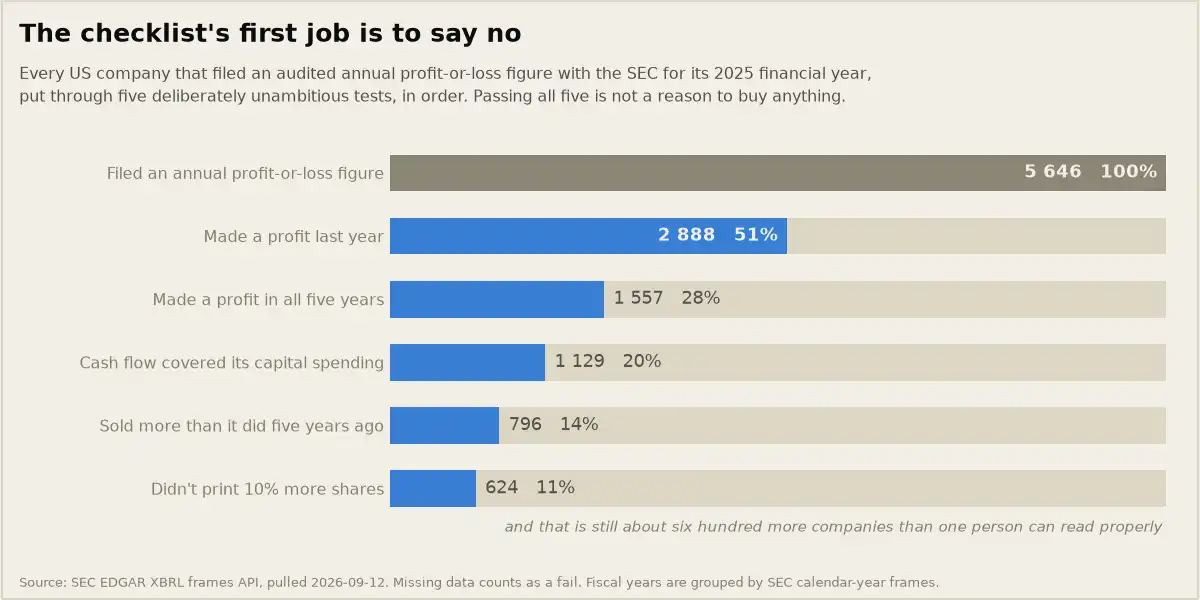
Two things this doesn’t show, it isn’t a claim that 89% of these companies are rubbish (reality -> plenty are young), or investing heavily on purpose, and a chunk fall out for a dull mechanical reason I’ll come back to, and it isn’t a buy list. Passing all five tells you a company is not obviously broken, which is about as informative as knowing a job applicant owns a suit.
What it shows is subtraction. Five lines that took an evening to write, applied without a single opinion, threw away nine companies out of ten, no stock tip has ever done that much work for me.
There is another result hiding in that number that took me longer to appreciate: doing nothing is an output too. I used to feel that spending two hours on a company and deciding not to buy it meant the two hours had been wasted, that’s backwards. If the process gives me a defensible no, it did exactly what I built it to do. A portfolio doesn’t have to contain the evidence that research happened.
Remember: the first job of a process is not to find good companies. It is to make the world small enough that the next step is possible at all. Selection comes last, and by then most of the work is already done.
So what is a “process”, exactly
Not a checklist, a checklist is one component. A process is the whole chain from money to decision, and the chain has more links before the interesting part than after it.
It helps to separate an investment process from a philosophy, because, personally, I spent a while confusing them. My investing philosophy is a set of beliefs about what I’m doing and why: I’m buying pieces of businesses, time is my only reliable edge, I’m the largest risk in my own portfolio. Beliefs point in a direction, but they do not tell me what to open on a Sunday afternoon.
A process is the machinery underneath. It says which companies I’m allowed to consider this month, on what evidence, at what size, and the part everyone skips, what specific fact would make me reverse the decision.
A philosophy can be believed, when a process has to be run.
Three ways picks-first quietly fails
No entry rule, so your attention belongs to somebody else. The watchlist problem I opened with. Without a mechanical filter, the companies you research are the companies that reached you: a headline, a podcast, a colleague, an ad. That’s not a strategy, it’s a distribution channel, and you’re the receiving end of it. The screen above doesn’t make me smarter than anyone, simply means the dozen companies I read this year were chosen by five rules I wrote in advance, rather than by whatever an algorithm put in front of me in March.
No written thesis, so nothing can be falsified. If the reason for owning something was never written down it can’t be checked later, so the position can never be sold for a reason, only for a feeling. Worse, a position with no written reason quietly changes category when the price moves: a trade becomes an investment somewhere around minus forty per cent, and the relabelling does no work except to make the loss stop hurting. The price alone tells you almost nothing, and this is the operational consequence, with no thesis on paper, the price is the only input you have left.
No sizing rule, so being right doesn’t pay. Two people can hold the same correct opinion and get opposite results, because one of them put in 1% and the other put in 40%. Sizing is where an opinion turns into an outcome, and it is almost never discussed in the same breath as picking. (Position Sizing is its own post, and I’m not going to fake my way through it in a paragraph here).
Only the middle one is about analysis. The other two are plumbing, and plumbing is what fails.
Even if someone handed you the right answer
Suppose we skip all of it. Suppose ten years ago somebody walked up and told you exactly which stocks to own for the next decade, no research, no process, just the answers. Collecting those returns still looked like this.
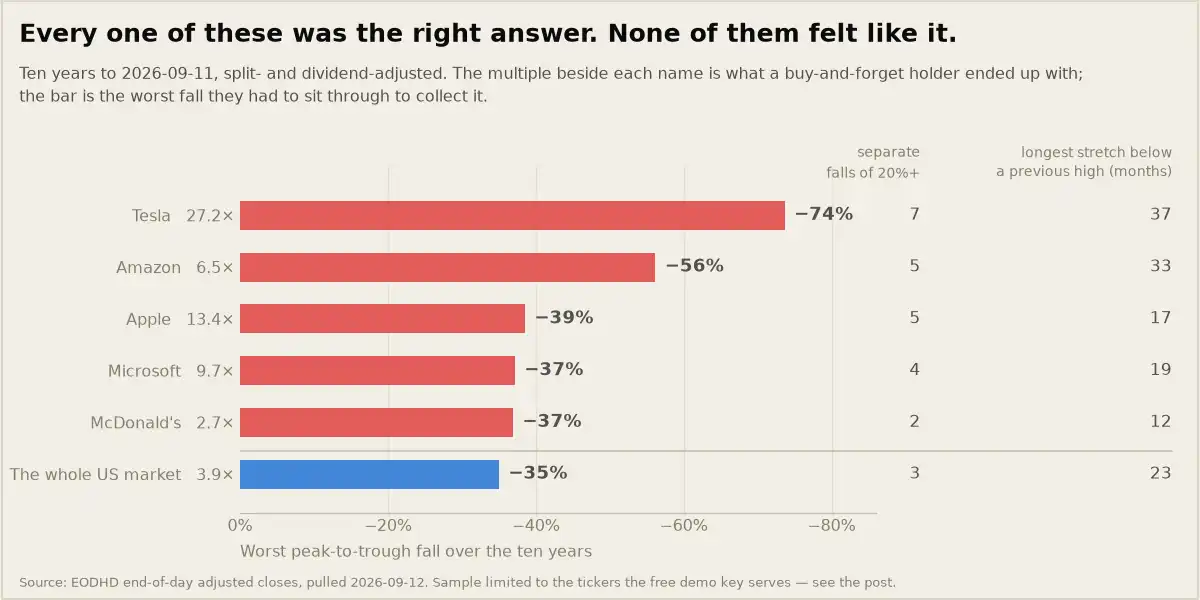
Tesla returned 24.8× over the ten years to 28 August 2026. It also fell 74% from a previous high and dropped 20% or more on seven separate occasions, and its longest unbroken stretch below a price it had already reached ran to 37 months. Three years, waiting to get back to level. Amazon returned 6.9×, fell 56%, and had a 33-month wait of its own. Apple returned 13.2× and fell 39%.
Then look at McDonald’s. Deeply unglamorous, 2.9× over the decade, and it still fell 37%, a worse drawdown than the whole US market managed over the same period. Boring did not mean smooth, boring meant boring and a 37% fall.
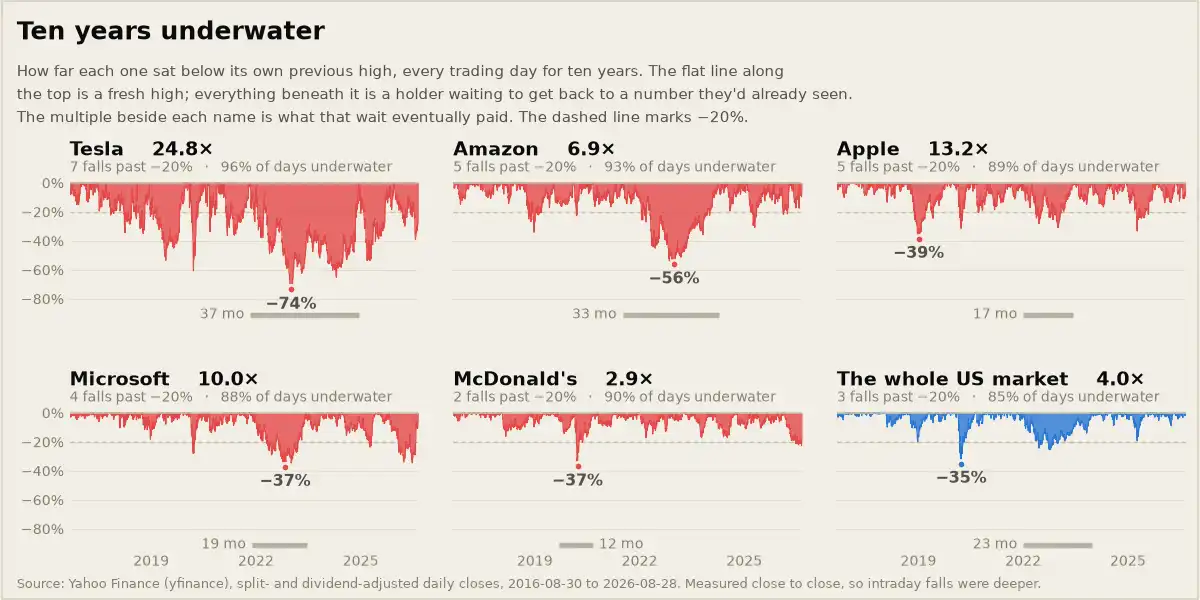
And the market itself, the single easiest thing in the world to hold: down 35% at its worst, with a 23-month stretch below a previous high. The median worst fall across the whole group was 38%.
So the perfect answer, handed over for free, still required someone to sit through a fall of nearly 40% without doing anything about it. On what basis? A pick that arrives with no reasoning attached gives you nothing to hold on to at minus forty. You didn’t build the argument, so you can’t check whether it broke. All you have is the number on the screen, and the number is screaming loud.
Remember: the pick was never the scarce ingredient. Ten years ago every one of those six was sitting in plain sight, on every brokerage platform in Europe. What was scarce was a written reason to hold, produced before the reason was needed.
This is the same wall I keep hitting from different directions: in the dip I kept waiting for, in why the market isn’t a casino. Behaviour under stress is not a personality trait you summon on the day. It’s an artefact of decisions already made in writing, back when nothing was happening. (The Investor’s Enemy: Impatience is where the evidence for that goes.)
Picks have a shelf life. Processes don’t.
One more number, because it settles the argument for me.
I ran the identical five tests against the numbers from four years earlier, using the 2017 to 2021 window instead of 2021 to 2025. Back then, 563 companies passed.
Today, 509 of those 563 are still filing annual figures with the SEC; 54 are simply gone, bought or merged or delisted. And of the original 563, only 308 still pass, 55%. Nearly half the list rotted in four years without a single one of the tests changing.
It works the other way too: 314 of today’s 622 survivors, almost exactly half, were not on the old list at all. Half of what I’d be looking at today is new since 2021.
A list of names is perishable, <span class=”hl-underline”the thing that generates the list is not. Hand me the 2021 list to file away as “the good companies” and I’d now be carrying a document that is wrong about 45% of its contents, with no way of telling which 45%.
Remember: a list of picks decays like fruit. The method that produced it keeps. Whatever you’re tempted to save from someone else’s work, save the method.
The process I actually run
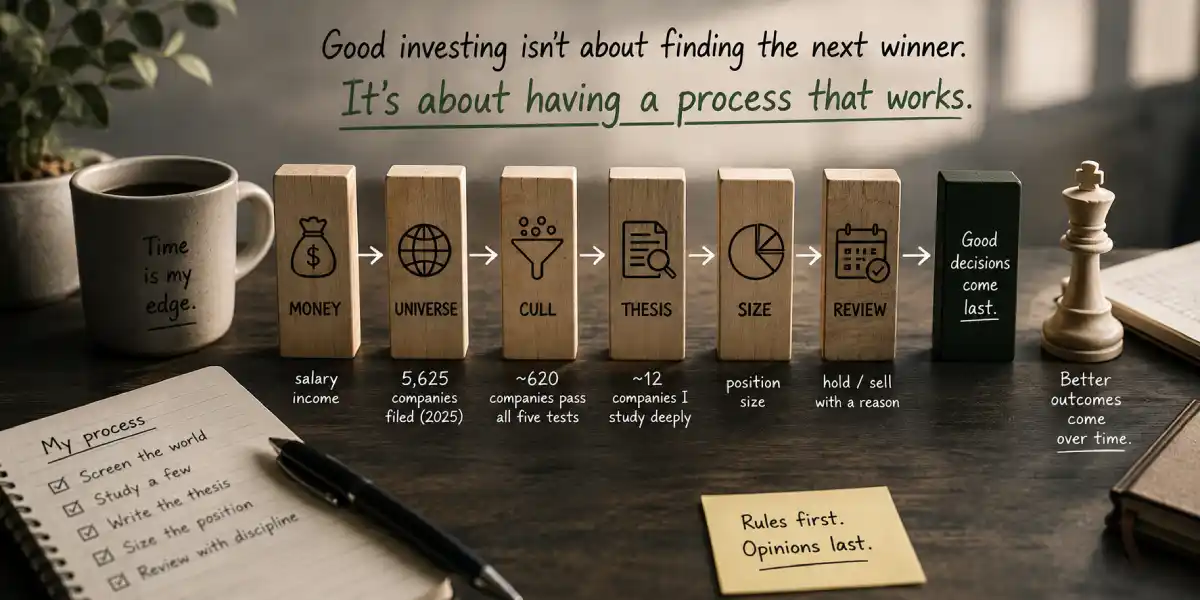
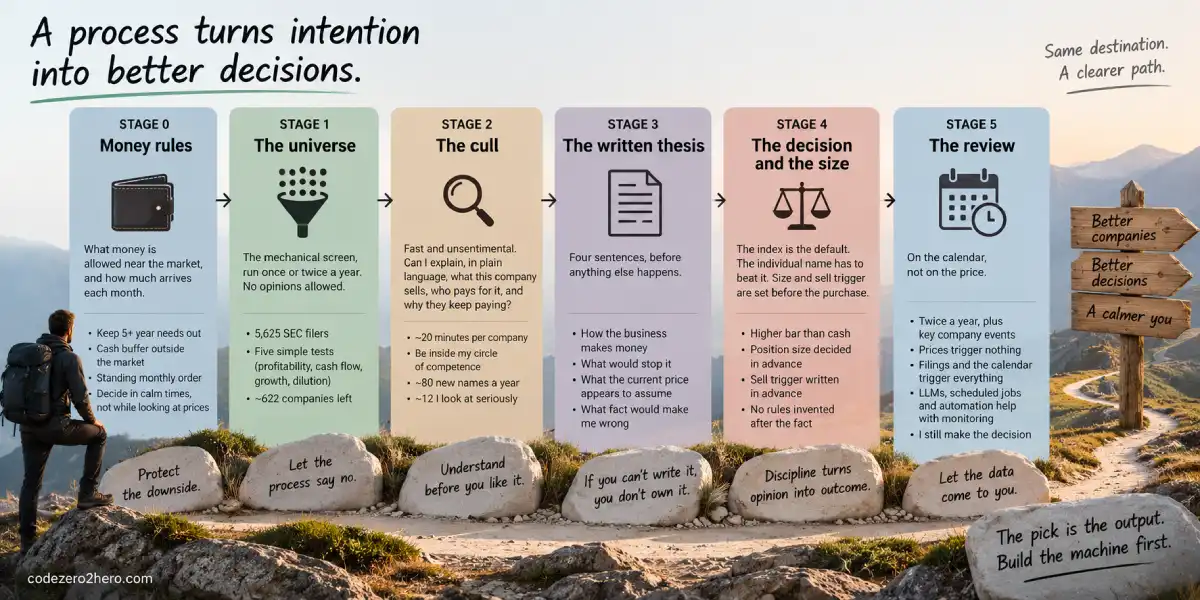
Six stages. What matters is the shape, how much happens before the part everyone thinks of as investing.
Stage 0 > the money rules. What money is allowed near the market, and how much arrives each month. Anything I need inside five years stays out, a cash buffer sits outside the whole arrangement, and what’s left becomes a standing order on a fixed date, so the monthly amount is decided once, in a calm week, rather than while looking at prices. This stage contains no companies at all, and it is the most important one: a forced seller’s process is “sell whatever there is”, and nothing above stage 0 survives that.
Stage 1 > the universe. The mechanical screen, run once or twice a year. No opinions allowed, which is the point: I’m not deciding anything here, I’m refusing to let my attention be allocated by whatever I happened to read, 5,625 down to 622.
Stage 2 > the cull. Fast and unsentimental, maybe twenty minutes a company. One question: can I write, in plain language, what this company sells, who pays for it, and why they keep paying? If I can’t write it in one sitting with the filing open, it’s out. Not out because it’s bad, out because it’s outside my circle of competence, and pretending otherwise is how people end up owning things they can’t defend. Six hundred-odd down to maybe a dozen a year I look at seriously.
That arithmetic only closes because of the churn number above. Triaging 622 companies at twenty minutes each is two hundred hours, which isn’t a hobby, it’s a second job. But the list is only built once. After the first pass I’m mostly triaging new entrants. The four-year comparison added 314 names that weren’t on the old list, roughly eighty a year on average. That’s half an hour a week rather than two hundred hours all over again. The first pass is expensive; everything after it is maintenance.
Stage 3 > the written thesis. The part that looks like investing, and it’s one stage out of six. Four sentences, before anything else happens: how the business turns effort into a money; what would stop it; what the current price appears to assume; and what fact, if I saw it, would tell me I was wrong. That last one is the whole exercise. If I can’t write it, I don’t understand the company well enough to own it, I just like it. (How I actually read a filing is a separate post, and we will get there; here I only care that the output exists in writing.)
Stage 4 > the decision and the size. The default is the boring index fund, and the individual name carries the burden of proof: it has to beat that default, which is a far higher bar than beating cash. Size gets written down while I hold no position and have no feelings about one. So does the sell trigger. A sell rule invented three weeks after the purchase, with the price already moving, is not a rule, <span class=”hl-underline”it’s a negotiation.
Stage 5 > the review. On the calendar, not on the price. Twice a year, plus whenever a company reports something that speaks directly to one of my four sentences. Prices trigger nothing, filings and the calendar trigger everything.
This is also where the tools available to us today make the process much easier to run. I don’t have to remember every earnings date, manually reopen every filing, or spend Sunday checking whether something changed. LLMs, scheduled jobs and automated data collection can do a lot of that boring monitoring for me: watch for new filings, pull the numbers, compare them with the previous period, and bring the changes back to the written thesis. The machine does the watching; I still make the decision. I’m building more of this into my own process now, and I’ll cover the implementation, including what I automate, what I deliberately don’t, and where I don’t trust an LLM, in separate articles.
Count them: one stage out of six is research. The other five decide what money is in play, what I’m allowed to look at, how much I commit, and when I look again. When a decision of mine has gone badly, it has never once been because stage 3 was insufficiently clever.
The same pipeline on one line each, if you want to steal the shape of it:
| Stage | What goes in | What comes out |
|---|---|---|
| 0 · Money rules | A salary | A monthly amount, and a line the market never crosses |
| 1 · The screen | 5,625 filings | ~620 companies I’m allowed to look at |
| 2 · The cull | ~80 new names a year | A dozen I’ll actually read |
| 3 · The thesis | A dozen companies | Four written sentences, or a no |
| 4 · Decision and size | A thesis | A position size and a sell trigger, both pre-committed |
| 5 · The review | A calendar | A thesis confirmed, or a sale with a reason attached |
“If your default is the index, why bother with any of this?”
It’s a total fair question, and the honest answer is slightly deflating: mostly I run the process so I can say no with a reason instead of a shrug.
Nobody drifts away from a boring index fund after careful analysis. They drift after a good story: someone at work who is up 60%, or a chart that has gone one way since spring. The process is what makes the story compete against something. It gives the default a defender.
The index is also not a decision you make once. You re-make it every month, usually while something more exciting is happening elsewhere. A written process is how I keep re-making it the same way, and how a Sunday afternoon spent on a company doesn’t turn into a purchase.
The measure of a process, for me, isn’t how many good companies it finds, it’s how many decent-looking ones it lets me put down without regret.
Where this is weak
Every test looks backwards. All five grade the past five years, so they systematically reject young companies that are losing money on purpose. Amazon would have failed test 1 for most of its first decade. This screen is a filter on history, and history is not the thing I’m buying. I take that trade because I’d rather miss a great business than pretend I can identify one before it has earnings.
Missing data counts as a fail, and that costs real companies. 475 companies fell at test 2, and another 82 at the last test, not because they did badly but because a number wasn’t there in the tag I asked for. Another 319 fell at test 3 for a related reason: banks and insurers don’t report capital spending the way a factory does, so the cash-flow test misfires across an entire sector. A checklist that guesses when the filing is silent isn’t a checklist, but some of that rejection is about accounting tags rather than business quality. Among the 2,439 companies where all five numbers were available, roughly a quarter pass rather than one in nine.
The first version of this screen was wrong, and it took a week to notice. XBRL stores share counts as they were originally reported, and a company that later splits its stock doesn’t go back to restate filings nobody reads anymore. So my dilution test quietly threw out NVIDIA, Netflix, Chipotle, Fastenal, Cintas and roughly a hundred others for “printing shares” that were arithmetic rather than issuance. I only caught it because Apple, which has been buying its own shares back for a decade, came out of the screen as a serial diluter, which is close to the opposite of the truth. The lesson is worse than the bug: a mechanical rule inherits every flaw in the data underneath it, and unlike a human it fails silently and with total confidence.
A process can turn into theatre. A checklist everything passes isn’t a checklist, and one that reliably produces the answer you already wanted is worse than none at all, because it launders a hunch into something that looks like work. My rough test: if six months go by and the process hasn’t rejected anything I liked, it has stopped being a process and become a ritual.
It says nothing about price, and it only sees what the SEC sees. A company can pass all five tests and be a terrible purchase today; the screen and the valuation are separate problems, and I’ve built the first one. EDGAR covers only companies that file with the SEC, so nothing listed in my country for example, ever appears; as a European whose core holding is a euro-denominated fund, having my only decent research tooling pointed at American paperwork is faintly absurd. ( Researching European Companies is on the list, mostly as a note to self.)
It hasn’t been stress-tested by me. I’ve run this for a few quarters, not a few cycles. Everything above is a hypothesis about my own behaviour, and those are the least reliable hypotheses there are. With that being said, lets go further.
My current rules
The page in the notebook, minus the lines I’ve crossed out twice:
- Nothing enters the watchlist that didn’t come through the screen, interesting is not a criterion.
- Twenty minutes to explain the business in plain language, or it’s out.
- No buy without four written sentences, including the one that would make me sell.
- Size decided before the purchase. Sell trigger written before the purchase.
- The index is the default, the individual name has to beat it, not beat cash.
- Review on the calendar or when the thesis is challenged, price alone never triggers a review.
Six lines, and every one exists to remove a decision from a moment when I’ll be bad at making decisions.
What the rules have cost
Rule 1 means I have never once looked at a company because it was interesting, and interesting is where most of the pleasure in this hobby lives.
Rule 5 means that when something I researched and passed on doubles, I own it only through the index, in an amount too small to feel. I get to watch that with my own notes open in front of me, which is a specific kind of annoying.
Rule 6 is the uncomfortable one. A falling price by itself gives me nothing to do. If the business reports something that touches one of my four thesis sentences, I review it immediately; otherwise I wait for the calendar. That means I will sometimes sit through ugly price moves doing absolutely nothing. I’m trading responsiveness to the screen for responsiveness to the business, and some quarters that is going to look stupid.
Changes my mind: if the screen and the cull between them produce nothing I’m willing to own for three years running, the rules are too tight, and I’m using process to avoid ever deciding anything. And if I catch myself buying something that entered sideways, through a conversation rather than through stage 1, then the process is decorative and I should stop claiming to have one.
Your turn
Thirty minutes, one page, three lists, no research required.
- What has to be true before you’re allowed to look at a company at all. Three to five mechanical lines, yours rather than mine. The only requirement is that they can be checked without an opinion.
- What you must be able to write before you’re allowed to buy. Not a paragraph of enthusiasm, specific sentences, including the one describing the fact that would make you wrong.
- What would make you sell. In advance, in writing, and not a price.
Then the part that stings: run the last three things you bought backwards through the page. Nobody is asking you to sell anything. Just find out which of them would not have made it past your own front door.
That page is your process, and it fits on one side of A4. If you can’t build it at all, that’s the finding. It means the picks were never the bottleneck.
The pick is the output. Build the machine first.
Behind the scenes: how the numbers were pulled, and what’s wrong with them:
The screen. Everything comes from the SEC’s XBRL “frames” API, which returns one reported concept for every filer in
one period NetIncomeLoss for CY2025 gives you 5,625 companies in a single request. That is the whole universe
definition: companies that filed an audited annual profit-or-loss figure tagged for the SEC’s 2025 calendar-year frame.
It is not “the S&P 500”, and it isn’t quite “US-listed stocks” either: it includes small filers and foreign private
issuers that file with the SEC, and a long tail of companies you have never heard of. Frames group by the SEC’s
calendar-year buckets, so a company with an odd fiscal year-end can land in a neighbouring frame.
Tag messiness. Revenue is the worst offender: three tags are in common use (Revenues,
RevenueFromContractWithCustomerExcludingAssessedTax, RevenueFromContractWithCustomerIncludingAssessedTax) and plenty
of filers use more than one. The script applies them in preference order. Capital spending uses
PaymentsToAcquirePropertyPlantAndEquipment with PaymentsToAcquireProductiveAssets as a fallback. Share count is
WeightedAverageNumberOfDilutedSharesOutstanding, which is an average over the year rather than a point-in-time count,
so it lags a late buyback or issuance.
Splits, and why the share-count test needs a second API. The frames API returns values as originally filed, which is
not the same as split-adjusted. Apple’s 2017 diluted share count sits in the data as 5.25 billion, from before the
four-for-one split in 2020; its 2025 count is 15.0 billion. Compare the two naively and Apple tripled its share count,
when in fact it has shrunk it every year since. The correction uses the companyconcept endpoint, which returns every
value a company has ever filed for one concept, including the same fiscal year restated in later filings. The ratio
between two reports of the same year is the split factor, so walking a company’s filings newest-to-oldest and chaining
the overlapping years puts everything on today’s basis. That’s one extra request per company, which is why the dilution
test runs last, when only a few hundred are left. It also means the number the raw frames give you, 634 survivors, with
NVIDIA, Netflix and Chipotle among the rejects, is wrong, and it is the number this post would have quoted if Apple
hadn’t looked so obviously silly.
Missing data is a fail. This is a judgement call and it matters. 475 companies dropped at test 2, 319 at test 3, 164 at test 4 and 82 at test 5 because a number wasn’t there in the tag I asked for, not because they failed the test. Restricting to the 2,439 companies with all five numbers available gives a 25.5% pass rate instead of 11.1%. Both numbers are in the post because both are true, and they answer different questions.
The churn test. The 2021 comparison runs the same five tests with the window shifted back four years — fiscal 2017 through 2021 — so the two windows overlap in a single year, 2021. “Still passing” means present in both survivor sets by CIK. Of the 563 that passed then, 54 have disappeared from the later frame entirely (delisted, merged, taken private) and 201 still file but no longer pass.
Prices. Split and dividend-adjusted daily closes from EODHD, ten years to 28 August 2026. Drawdowns are measured close-to-close on the adjusted series, so intraday lows were deeper than the figures quoted. “Months below a previous high” is the longest single stretch, measured from the first close beneath a peak to the first close that gets back to it, not the total time spent underwater, which is larger for every name here. The sample is six tickers because the free public demo key serves six tickers: a genuinely arbitrary sample, chosen by an API rather than by me. It happens to include the whole US market as a control, which is the comparison I care about most. Everything is in dollars, and a euro-based investor lived through those drawdowns differently again. Currency is a post I still owe.
Not included: fees, taxes, spreads, or the survivorship that is baked into any backward-looking screen. The point of the exercise is the size of the subtraction, not precision to the last company.
Companion code:
-
process_before_picks.py> pulls every figure above from the SEC’s XBRL frames API and EODHD, runs the five-test funnel, re-runs it on the four-year-old numbers, computes the drawdowns, writeschecklist_survivors.csvwith all 622 names, and renders both charts. Re-run it whenever you like; the numbers will have moved, which is rather the point. This is education, not investment advice, I’m a student of this, learning in public.* -
yahoo_drawdowns.py> pulls the market-price history used for the holding analysis and calculates drawdown depth, separate falls of 20%+, longest stretches below previous highs, and time spent underwater.
Read next:
-
Prerequisite: My Investing Philosophy: What I Believe So Far > the beliefs this process exists to execute.
-
Related: Circle of Competence > what stage 2 is really filtering for and How I Use SEC EDGAR to Compare Companies > the same data source, one company at a time.
-
Next lesson: The Investor’s Enemy: Impatience (coming, the evidence that temperament, not intelligence, decides what investors actually earn).
Comments
0