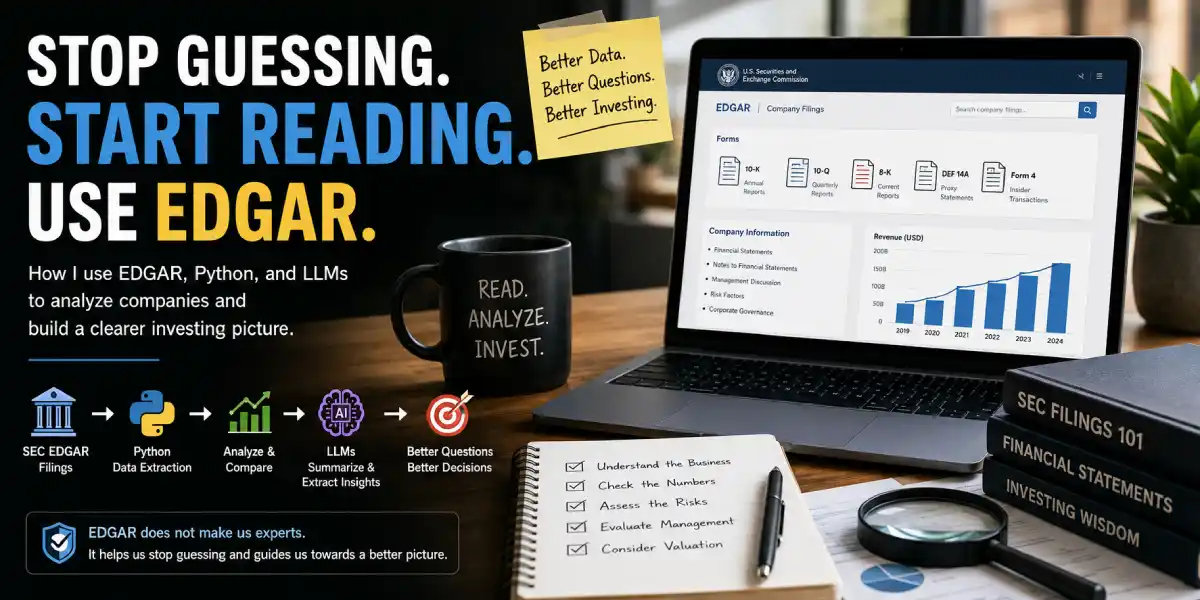
Watching the price and reading the news feels like research, but mostly it is reacting to how other people feel. A company’s own filings will not tell you where the stock is going—only what you are actually buying.
Part 1 of 2 The Filings and the Right Questions
When I started investing, I thought financial research meant reading news, checking stock prices, watching YouTube videos, and trying to guess what the market would do next.
That was not investing, that was mostly reacting.
Public markets give ordinary investors a treasure map, but most of us either dont know about it, either ignore it and follow the loudest influencers instead.
That treasure map is called EDGAR.
EDGAR is the SEC’s public database where companies file their official reports. It is free, public, and boring in the best possible way. It does not promise quick money, it does not tell you which stock will go up tomorrow. But it gives you something much more useful: access to the actual filings behind the business and that is pure magic!
Together with Python and LLMs, these days we can do something that would have felt impossible to me as a beginner: read filings faster, extract financial data, compare companies, summarize risks, and build a more evidence-based investing process.
Dont take it wrong, EDGAR does not make me an expert. Python and LLMs do not make me an analyst overnight. But together, they help me stop guessing, ask better questions, and slowly build a clearer picture of the business before I invest.
This is the first of a two-part guide.
- Part 1 (this article) covers what EDGAR is, why it matters, which filings I care about, and how I use them to compare companies and ask better questions.
- Part 2 turns those filings into data with Python.
I am not using EDGAR because I want to look smart. I am using it because I want fewer guesses and more evidence, so shall we?
Key Takeaways
Before going deep, here is the simple version:
| Filing | Beginner Meaning | Why I Care |
|---|---|---|
| 10-K | Annual health check | The full yearly report: business model, risks, financial statements, debt, cash flow, and management discussion. |
| 10-Q | Quarterly update | Shows how the business is performing during the year. Useful for tracking growth, margins, cash flow, and new risks. |
| 8-K | Breaking news | Reports major corporate events like CEO changes, acquisitions, earnings releases, auditor changes, or serious business updates. |
| DEF 14A | Management and voting document | Helps me understand executive compensation, board structure, and shareholder voting matters. |
| Forms 3, 4 & 5 | Insider transaction reports | Show when insiders acquire or sell shares. Form 4 (changes in holdings) is the one I watch most, but treat it as a signal, not a complete thesis. |
The big idea is simple:
EDGAR does not tell me what to buy. It helps me understand what I am actually buying.
The Process at a Glance
Before the details, here is the whole workflow on one page. Everything in the rest of this post is just filling in these boxes:
SEC EDGAR Filings
        |
   10-K, 10-Q, 8-K, DEF 14A, Forms 3/4/5
        |
   Python Data Extraction
        |
   Revenue, margins, cash flow, debt, share count
        |
   Company Comparison  (Competitor A vs Competitor B)
        |
   Business Questions
        |   Why are margins higher?
        |   Why is free cash flow falling?
        |   Why is debt increasing?
        |   Why is revenue slowing?
        |
   Investment Thesis
        |   What do I believe?
        |   What would prove me wrong?
        |   What price would make sense?
        |
   Decision
The sequence matters because I do not want to jump straight from “I like this company” to “I bought the stock.” That is too fast. EDGAR helps me slow down and move through a better order:
filing → data → comparison → question → thesis → decision
The goal is not to collect numbers forever, my goal is to make better decisions.
What Is EDGAR?
EDGAR stands for Electronic Data Gathering, Analysis, and Retrieval About EDGAR.
It is the SEC’s electronic filing system and public database. Public companies use it to submit legally required reports, and investors can use it to access those reports for free.
Through EDGAR, I can research a company’s financial information, operations, risks, management discussion, major events, insider transactions, and shareholder-related documents.
The important part for me as a beginner is this: EDGAR is where I can go closer to the source.
- Not someone’s opinion about the company.
- Not a headline.
- Not a social media thread.
- Not a price target.
- The company’s own filings.
That does not mean the filings are perfect. Companies still present themselves carefully, and management still tells a story. But the numbers, risks, accounting notes, debt, cash flow, and business descriptions are far more useful than looking at a stock price and saying, “This looks cheap”.
Why EDGAR Matters for Beginner Investors
A stock is not just a ticker; it represents ownership in a business. If I buy shares of Microsoft, Meta, Nvidia, Apple, or any other public company, I am not just buying a moving price on a screen. I am buying a small piece of a company with revenue, costs, assets, liabilities, risks, competition, management decisions, and future uncertainty.
EDGAR helps me answer better questions:
- Is revenue growing?
- Are profits growing faster or slower than revenue?
- Is the company generating real cash flow?
- Is debt increasing?
- Are margins improving or deteriorating?
- What risks does management disclose?
- What does the company actually do?
- Is the business becoming stronger or weaker?
- Are insiders buying or selling?
- Has anything major happened recently?
Before EDGAR, I was more likely to ask: “Is this stock going up? … or down?”
After EDGAR, I am trying to ask: “Is this business improving, and am I paying a reasonable price for it?” and that is a much better question.
The Main SEC Filings I Care About
EDGAR contains many types of filings (Using EDGAR to Research Investments). As a beginner, I do not need to understand every single one immediately. I start with the filings that matter most.
1. Form 10-K: The Annual Report
The 10-K is the company’s annual report filed with the SEC, and it is usually the most important document for long-term investors. It includes:
- What the company does, and its business segments
- Risk factors
- Revenue and profit
- The balance sheet
- The cash flow statement
- Debt
- Legal issues
- Management discussion
- Accounting policies
- Share count, and references to executive compensation
The 10-K is not light reading. It can be long, dry, and intimidating. But it is also powerful, and if I want to understand a company seriously, it is one of the first places I go. Reading 10-Ks from multiple companies will not improve your Goodreads rating. These are not cozy Sunday books. But they may teach you more about a business than ten polished investor presentations.
When I read a 10-K, I do not try to understand everything at once. I usually focus on five things:
- Business description —> what does this company actually sell?
- Risk factors —> what could go wrong?
- Management Discussion and Analysis (MD&A) —> how does management explain the year?
- Financial statements —> are revenue, profit, cash flow, and debt moving in the right direction?
- Notes to financial statements —> are there accounting details that change the story?
The 10-K helps me move from “I like the company” to “I understand the business a little better.”
2. Form 10-Q: The Quarterly Report
The 10-Q is the quarterly update. It is usually shorter than the 10-K – thankfully – and is filed three times per year. The fourth quarter is normally folded into the annual 10-K.
In other words, the 10-Q is the company checking in during the year: “Here is how the last quarter went, here is what changed, and here is what investors should know before the full annual report arrives.” The 10-Q helps me track whether the business is improving or deteriorating during the year. I use 10-Qs to check:
- Quarterly revenue growth
- Gross margin
- Operating income and net income
- Free cash flow trends
- Inventory and debt changes
- Management commentary and any new or changing risks
If I am comparing two companies in the same industry, 10-Qs let me see which one is growing faster, which has better margins, and which converts revenue into cash more efficiently. This is where EDGAR becomes genuinely useful for comparisons.
3. Form 8-K: Major Current Events
The 8-K reports important corporate events between quarterly reports like earnings releases, CEO changes, acquisitions, bankruptcy, major agreements, auditor changes, or significant financial updates.
Businesses do not only change once per quarter. A CEO resigns. A company announces a big acquisition, raises debt, releases preliminary results, or warns investors about a problem. The 8-K helps me avoid being blind between the 10-Q and 10-K.
4. DEF 14A: Proxy Statement
The proxy statement is useful when I want to understand management, voting matters, executive compensation, and board structure. As a beginner I do not always start here, but it matters when I ask:
- How much is management paid?
- Are executives rewarded for long-term performance or short-term stock movement?
- Who sits on the board?
- What are shareholders voting on?
- Does compensation look reasonable?
Management incentives matter. A great business can still be damaged by poor capital allocation or bad incentives.
5. Forms 3, 4, and 5: Insider Ownership and Transactions
Forms 3, 4, and 5 cover insider ownership and transactions. Form 4 is the interesting one because it reports changes in insider holdings buying and selling > usually within a couple of business days.
But you need to be careful. Insider selling does not automatically mean something is wrong; executives sell for taxes, diversification, estate planning, or scheduled plans. Insider buying can be more interesting, because executives are choosing to put more of their own money into the company. Still, I never make a decision only because of a Form 4. It is a signal, not a full thesis and should be used accordingly.
The Big Beginner Mistake: Looking at Stock Price Instead of Business Value
Before learning about filings, I made a common mistake. I would look at a stock and think “$500 per share is expensive” or “$5 per share is cheap”. and that is a wrong apporach, getting you to a gessing game. The stock price alone tells me almost nothing. A company with a $500 share price can be cheaper than one at $5, depending on earnings, cash flow, growth, share count, debt, and business quality.
EDGAR does not directly tell me whether a stock is cheap, but it gives me the raw material to think properly. Instead of asking “Is the price low?”, I can ask:
- How much revenue does the company generate?
- How much profit does it keep?
- How much cash flow does it produce?
- How fast is it growing, and how durable is the business?
- How much debt does it carry, and how many shares exist?
- What risks could change the story?
This is how I slowly move from price guessing to business analysis.
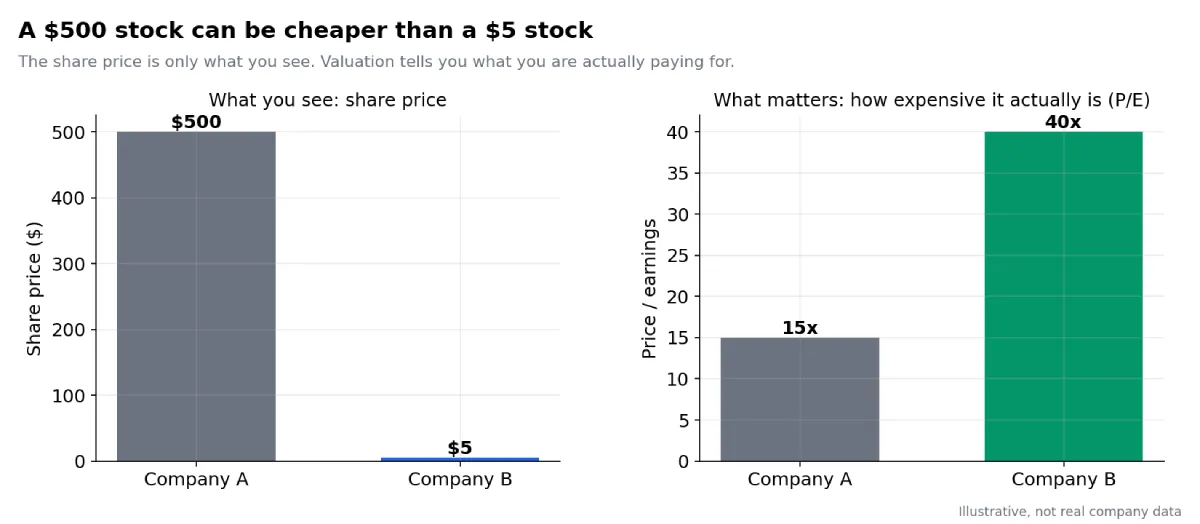 Illustrative -> a $500 stock can be cheaper than a $5 stock once you look at what you get for the price.
My EDGAR Workflow, Step by Step
EDGAR can be overwhelming if I open it without a plan, so I use it with specific questions. I do not want to “read filings” randomly, I want to investigate.
Step 1: Start With the Business
Before I look at valuation, I want to understand the company. My first questions: What does it sell? Who are the customers? How does it make money? Is revenue recurring or one-time? Is the business cyclical? Does it depend on one product, one customer, or one geography? What are the main risks?
This is where the 10-K business section helps. For example, comparing two AI/data-center names, it would be lazy to say “both are AI companies.” One might sell chips and systems; the other sells networking equipment and software. They may both benefit from data-center growth, but they are not the same business. EDGAR helps me avoid dropping companies into the same bucket just because the market narrative sounds similar.
Step 2: Compare Revenue Growth
Revenue is not everything, but it is the first sign of business demand. If revenue is growing, I want to know why: more units, higher prices, acquisitions, a temporary cycle, or a structural trend?
Revenue growth becomes more useful compared across similar companies. The question is not simply “which company grew?” The better question is: which is growing faster, more consistently, and with better economics?
Step 3: Compare Gross Margin
Gross margin tells me how much is left after the direct cost of producing goods or services:
$$ Gross Margin = Gross Profit / Revenue $$
Strong gross margins can signal pricing power, efficient operations, valuable intellectual property, software-like economics, or a strong brand. But gross margin depends heavily on the industry; software is naturally high-margin, a retailer is naturally low-margin, a carmaker is different again. So I compare gross margin mostly between similar companies.
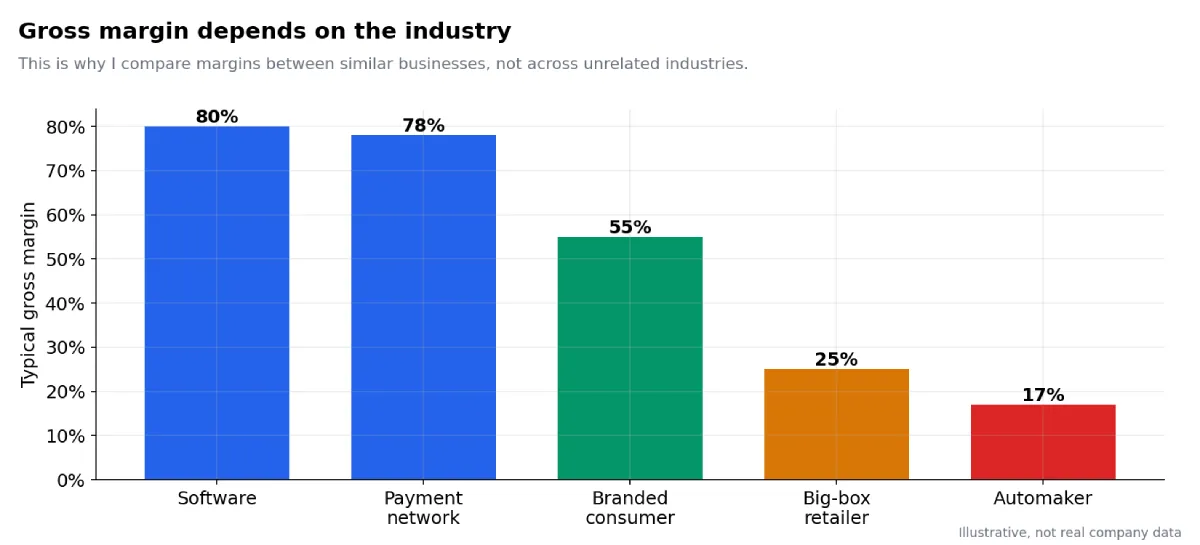 Illustrative -> gross margin depends heavily on the industry, which is why I compare like with like.
If revenue is growing but gross margin is falling, I need to understand why: heavy discounting, rising input costs, more competition, a shift into a lower-margin business, or a changed product mix. The number creates a question; the filing helps me investigate the answer.
A note on segment-level margins. I sometimes want to compare just one part of a company, let’s say one company’s cloud business against another’s. Be warned: company-wide revenue and gross profit are tagged cleanly in the structured XBRL data, but segment-level gross margin usually is not. Segment disclosures live in the MD&A and the notes, in formats that vary by company, and they often report segment operating results rather than a clean segment gross margin. So segment comparisons typically mean reading the MD&A by hand, not pulling a tidy number from the API. Do not expect a script to hand you “cloud gross margin”, it almost never exists as a single tagged field (but dont worry if you are lazy, this days we have LLMs to the rescue).
Step 4: Compare Operating Margin
Operating margin shows how much operating profit remains after operating expenses (R&D, sales and marketing, general and administrative):
$$ Operating Margin = Operating Income / Revenue $$
This helps me see how scalable the business is. If revenue grows 20% but operating income grows 40%, that may suggest operating leverage. If revenue grows and operating income does not improve, I need to understand why; aggressive investment, rising costs, more competition, or inefficiency. Operating margin keeps me from blindly celebrating revenue growth. Not all growth is good growth.
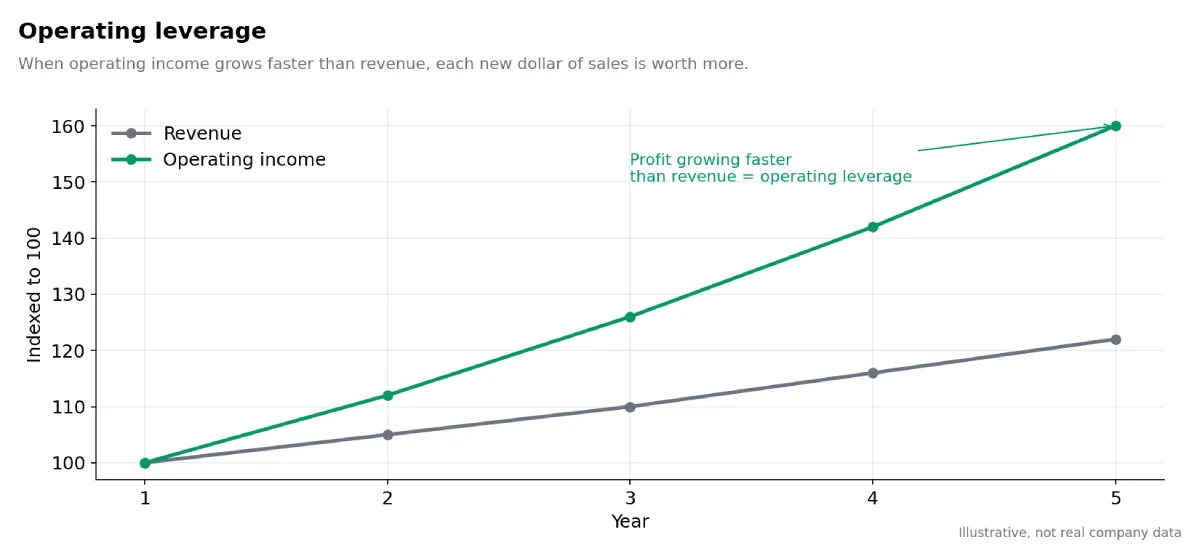 Illustrative -> operating leverage: when operating income grows faster than revenue.
Step 5: Compare Free Cash Flow
Net income matters, but so does cash. A company can report profits while struggling to generate cash. Free cash flow is commonly calculated as:
$$ Free Cash Flow = Operating Cash Flow − Capital Expenditures $$
It is the cash left after maintaining and investing in the business, and it can fund reinvestment, dividends, buybacks, debt repayment, acquisitions, or cash reserves.
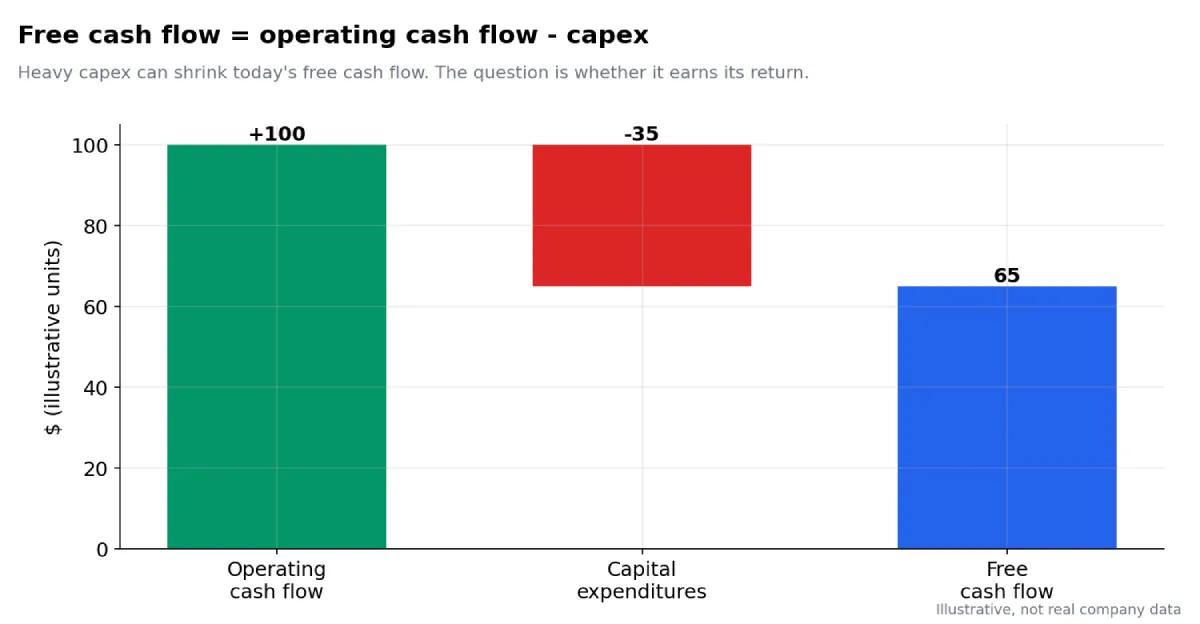 Illustrative -> free cash flow = operating cash flow minus capital expenditures.
Be careful here too: some companies have temporarily low free cash flow because they are investing heavily. A company spending aggressively on data centers may show pressure on free cash flow today while management bets those investments produce future growth. The question is whether those investments will earn good returns. This is where investing becomes judgment, not just math.
Step 6: Compare Debt and Cash
High debt is not automatically bad, and no debt is not automatically good. But debt changes risk. I want to know: How much cash does the company hold? How much debt? Is debt increasing? Can operating cash flow cover interest and obligations? Is the business cyclical? Could it survive a bad year?
A highly profitable company with stable cash flows can often handle more debt than a weak cyclical company. As a beginner, I prefer not to ignore debt, because debt can turn a temporary business problem into a permanent shareholder problem.
Step 7: Read the Risk Factors
The risk-factor section is not fun, it can feel repetitive and legalistic, but it matters. Companies must disclose material risks, and even when the language is generic, the section reveals what management considers important. I look for customer concentration, supplier dependence, regulatory risk, competition, technology disruption, cybersecurity risk, debt and liquidity risk, legal proceedings, geographic exposure, dependence on key people, margin pressure, and inventory risk.
I do not read risk factors to become scared of every company; every company has risks. I read them to ask: iwhich risks could seriously damage my investment thesis?
Context Matters: Do Not Misread the Numbers
One beginner mistake is reacting to a single number too quickly. If quarterly revenue falls, that does not automatically mean the business is collapsing. Some businesses are seasonal, retailers often have stronger fourth quarters because of holiday shopping. Some software companies have renewal cycles, some hardware companies have product cycles, and some industrial companies are cyclical and depend on the broader economy.
That is why I compare the right periods. A quarter-over-quarter comparison can be misleading, for many businesses, year-over-year is more useful:
- Q4 this year vs. Q4 last year
- Full year this year vs. full year last year
- Trailing twelve months vs. the previous trailing twelve months
Seasonality does not excuse bad performance, but it gives context. The number tells me what happened; the context helps me understand whether it matters.
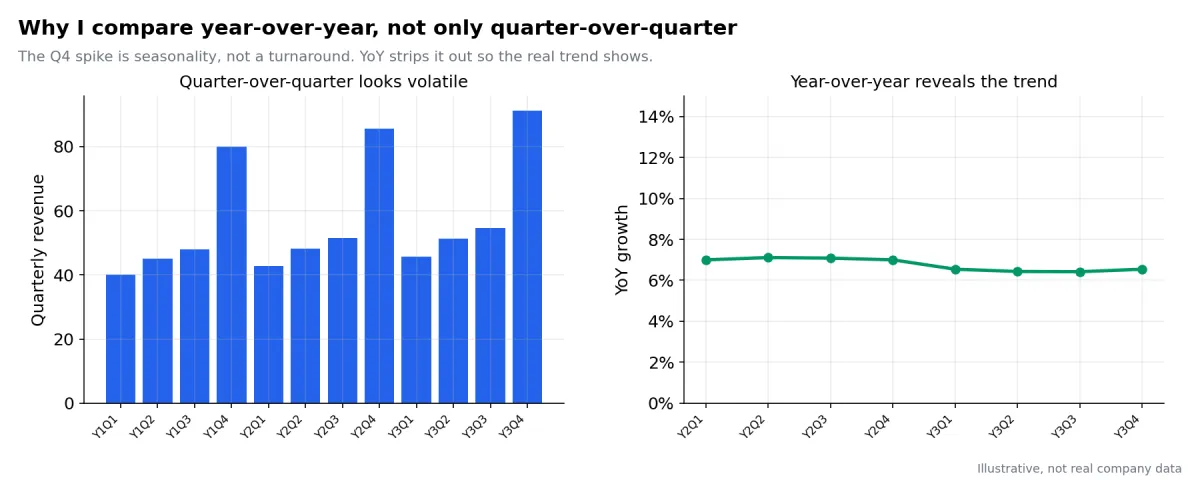 Illustrative -> the same revenue: quarter-over-quarter looks volatile, year-over-year reveals the trend. (This is
exactly why the Python scripts in Part 2 produce both annual and quarterly series and why quarterly growth there
is measured year-over-year, not against the prior quarter).
Illustrative -> the same revenue: quarter-over-quarter looks volatile, year-over-year reveals the trend. (This is
exactly why the Python scripts in Part 2 produce both annual and quarterly series and why quarterly growth there
is measured year-over-year, not against the prior quarter).
Comparing Companies: Three Worked Examples
Once I have the data, the value comes from comparison. I keep to three examples here, each chosen to teach a different lesson and each comparing reasonably similar businesses, since cross-industry margin comparisons are mostly meaningless.
Example 1 Visa vs. Mastercard: the clean comparison
This is about as close to apples-to-apples as public markets get. Both run global payment networks with similar economics, so the comparison is unusually fair.
Useful questions:
- Which company grows revenue more consistently?
- Is growth coming from more transactions, higher payment volume, cross-border recovery, other services or better pricing?
- Which has higher operating margins, and is the gap widening or narrowing?
- Which company converts more revenue into free cash flow?
- How much free cash flow does each produce, and how do they use it?
- Are buybacks actually reducing share count, or mostly offsetting stock-based compensation?
- Which company has better return on invested capital?
- Are they exposed to the same regulatory risks around fees, routing, and competition?
- Is either company more vulnerable to fintech wallets, account-to-account payments, or alternative payment rails?
- What would prove the investment thesis wrong for each company?
Because the businesses are so similar, differences in the numbers point to real differences in execution rather than to differences in business model. This is the example to start with.
Example 2 Coca-Cola vs. PepsiCo: similar label, different mix
These two look like obvious rivals, and in some ways they are. But they are not the same business. Coca-Cola is built largely around beverages, concentrates, brands, and a bottling/franchise ecosystem. PepsiCo also has a major beverage business, but it owns a large snacks business through brands like Lay’s, Doritos, Cheetos, and Quaker.
That difference in business mix shows up directly in the numbers, especially in margins, growth drivers, and capital needs.
Useful questions:
- Why are the gross margins different? Hint: look at the business mix, not only at “who is better.”
- How much of each company’s growth comes from price increases versus volume growth?
- Which segments are driving revenue growth?
- Does the snacks business make PepsiCo more diversified, or does it make the comparison less clean?
- How does Coca-Cola’s bottling and concentrate model affect margins and capital intensity?
- Which company converts revenue into free cash flow more efficiently?
- Which company has stronger pricing power during inflation?
- Which company is more exposed to commodity costs, packaging costs, and distribution costs?
- How much debt does each company carry, and is it manageable?
- Are dividends and buybacks funded comfortably by free cash flow?
The above example, in my view, teaches one of the most important comparison habits:
When two similar-looking companies show different numbers, the first question is not “which one wins?”
The first question is: “Are these businesses actually the same?”
Sometimes the answer is no and if the businesses are not the same, the numbers should not be judged as if they are.
Example 3 Apple vs. Microsoft: same “big tech” label, different economics
Both are mega-cap technology companies, and lazy analysis often treats them as interchangeable, but they are not the same business. Apple leans heavily on hardware product cycles, especially the iPhone, while its services business adds a growing layer of recurring, higher-margin revenue. Microsoft leans more on recurring software, enterprise relationships, cloud infrastructure, and subscription-like revenue. That difference changes the way I should read the numbers.
Useful questions:
- Which company has more recurring revenue?
- Which company depends more on hardware replacement cycles?
- Which has stronger and more stable margins?
- Which company converts more revenue into free cash flow?
- Which business is more exposed to consumer spending cycles?
- Which business is more exposed to enterprise IT spending cycles?
- How much does each company rely on buybacks to grow per-share results?
- Are margins improving because the business is becoming stronger, or because the revenue mix is shifting?
- Which company has more balance sheet flexibility?
- What would prove the thesis wrong for each company?
This is also where the segment caveat matters. I might want to compare Microsoft’s cloud margin against Apple’s services margin. That sounds logical, but those segment-level margins are not always cleanly available through structured EDGAR data. The company-wide numbers are easy, the segment numbers are homework.
For that comparison, I need to read the MD&A and segment notes in the 10-K by hand (or with some help – LLMs), that is annoying, but it is also where better understanding comes from.
Using LLMs With EDGAR
EDGAR filings can be long and intimidating, and this is where LLMs help if I use them carefully. I do not want an LLM to “decide” whether I should buy a stock. That would be lazy, instead, I use it as a research assistant.
For example, I can paste the Risk Factors section from a 10-K and ask:
- What are the main risk themes?
- Which risks are company-specific and which are generic boilerplate?
- Did the risk language change compared with last year? Are new risks appearing?
- Is management warning about customer concentration, regulation, debt, competition, or technology disruption?
Risk sections are full of repeated legal language, and an LLM can help me spot the patterns and the changes faster. But I still check the original filing, the LLM is not the source, EDGAR is the source. The LLM helps me read faster, summarize better, and ask sharper questions.
Common Pitfalls When Using EDGAR
EDGAR is powerful, but I can still misuse it. Here are the traps I try to avoid.
1. The Garbage In, Garbage Out Trap
Python can extract data quickly, but fast data is not always good data. Companies use different XBRL tags, classify items differently, and sometimes include one-time events. If I blindly trust a script without checking the filing, I can build a beautiful spreadsheet full of wrong conclusions. (In Part 2, the cash-and-debt script is a live example: debt tagging is so inconsistent that its figure is explicitly labeled an estimate to be verified by hand). Automation does not remove responsibility, it increases the need for validation or the increase number of tokens to get this done.
2. The Non-GAAP Trap
Companies often highlight non-GAAP metrics adjusted earnings, adjusted EBITDA, adjusted margins, adjusted free cash flow in earnings releases and presentations. These are not automatically bad; sometimes they help by excluding genuinely unusual items. But they can also make results look better than standard accounting numbers. So when I see ” adjusted” anything, I ask: What exactly was adjusted? Is it truly one-time, or does it happen every year? Are stock-based compensation or restructuring costs being excluded too aggressively? The company wants me to focus on the nicest version of the numbers; EDGAR lets me check the full version.
3. The Analysis Paralysis Trap
A 10-K can run well past 100 pages, which scares beginners away. But I do not need to understand every footnote on day one. I can start small what does the company do, is revenue growing, are margins strong, is it profitable, is free cash flow positive, how much debt, what are the biggest risks. That is already far better than buying because of hype. The goal is progress, not perfection.
4. The Single-Year Trap
One year of data can lie. A company can have one amazing year because of a temporary boom, or one terrible year because of a temporary crisis. That is why I look at multiple years and watch the itrend, revenue, gross margin, operating margin, free cash flow, debt, and share count over time. Investing is not only about what happened this year; it is about whether the business is getting stronger or weaker.
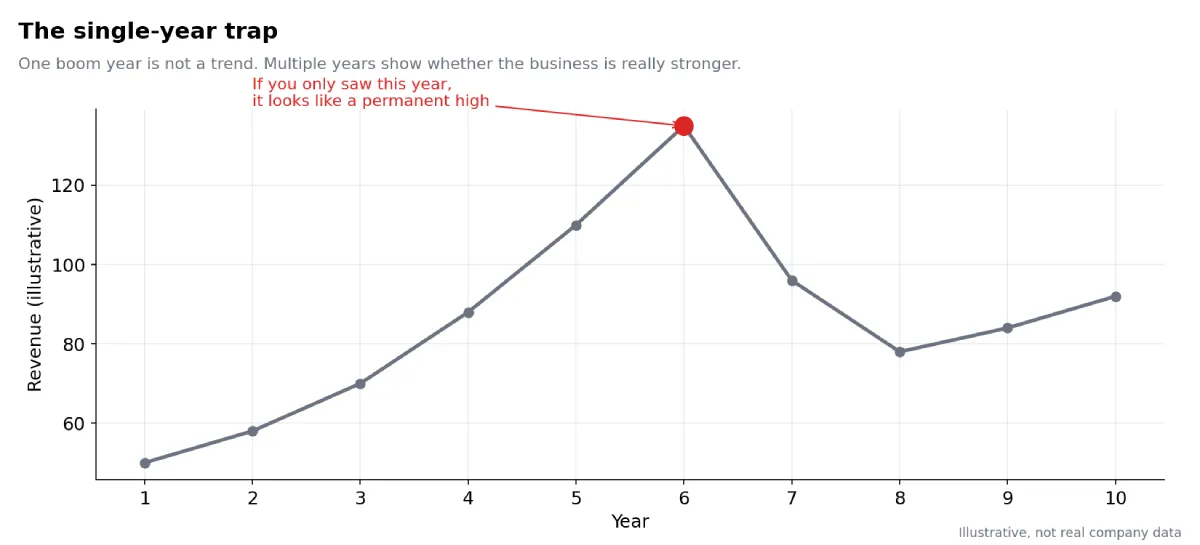 Illustrative -> the single-year trap: one boom year is not a trend.
My EDGAR Checklist Before Buying a Stock
Before I even think about buying an individual stock, I want to slow down and walk through a basic checklist. This roadmap is not a magic formula, and it does not make me an expert, but it helps me stop guessing and build a clearer picture of the business before I put money at risk.
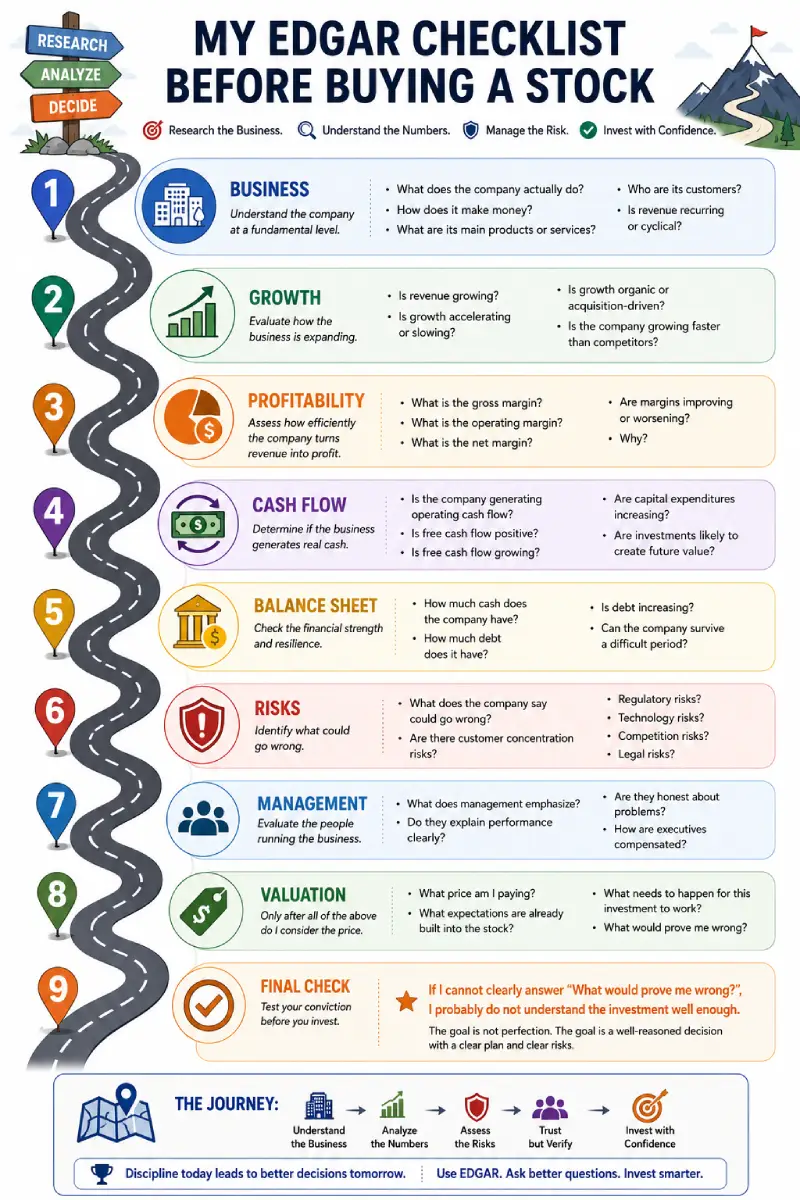
So, before I’m buying an individual stock, I try to answer these questions.
Business -> What does the company do, and how does it make money? What are its main products or services? Who are its customers? Is revenue recurring or cyclical?
Growth -> Is revenue growing? Is growth accelerating or slowing? Is it organic or acquisition-driven? Is the company growing faster than competitors?
Profitability -> What are the gross, operating, and net margins? Are they improving or worsening, and why?
Cash Flow -> Is the company generating operating cash flow? Is free cash flow positive and growing? Are capital expenditures rising, and are those investments likely to create future value?
Balance Sheet -> How much cash and how much debt? Is debt increasing? Could the company survive a difficult period?
Risks -> What does the company say could go wrong? Customer concentration, regulatory, technology, competition, or legal risks?
Management -> What does management emphasize? Do they explain performance clearly and admit problems? How are executives compensated?
Valuation -> Only after all of that: What price am I paying? What expectations are already built into the stock? What needs to happen for this to work and what would prove me wrong?
That last question matters most. If I do not know what would prove me wrong, I probably do not understand the investment.
Coming Up in Part 2
Everything so far has been about reading: which filings matter, what questions to ask, and how to compare businesses without fooling myself. That foundation is most of the work.
Part 2 is the hands-on half, turning those filings into data with Python. I will share a small toolkit that downloads a company’s filings once, then extracts revenue, margins, operating income, cash flow, and debt in both annual and quarterly form, so I can run the same comparison across companies again and again. The goal is never to automate the thinking. It is to automate the data collection so I have more time to think, analyze, judge and decide.
Appendix
Generate the Illustrative Concept Charts with Python
View [blog_figures.py] (https://github.com/codezero2hero/scripts/tree/main/blog_articles/how-i-use-sec-edgar-to-compare-companies-instead-of-guessing) on GitHub
This script generates the six illustrative teaching charts used in the article: price versus value, gross margin by industry, operating leverage, the free-cash-flow waterfall, seasonality (quarter-over-quarter versus year-over-year), and the single-year trap. The numbers are stylised, not real company data and each chart is labelled “Illustrative”.
Disclaimer
This article is for educational purposes and reflects my own learning process. It is not investment advice. Always do your own research and consider speaking with a licensed professional before making investment decisions.
Comments
0