
In the past, I used to think that one of the hard part of investing was knowing what to buy, and well it isn’t. I’ve known roughly what belongs in my portfolio for a while now, a short list of businesses I can actually explain. Getting to that answer, was not an easy feat, it took me months of reading. The harder part is the twenty-odd years after the answer is written down, when most of the months produce nothing worth describing at a dinner table and the thing being tested at the end of the say, is not your intelligence but your willingness to leave a sensible plan alone.
During the era that cost me $28,000 I would have told you that, my main and biggest problem was lack of information, but well at that time, I didn’t know enough. So my strategy was, go back and read more, much more, and the reading made it worse, because every article I read was published that week and therefore about that week. I was constantly feeding a long-term problem with short-term information, and it took a while, till I reached to this conclusion.
What I actually had was a clock problem. Businesses compound on a clock measured in years. My broker app refreshed every second, my feelings refreshed every time I opened it, which was often enough that I’ve decided not to estimate the number in public.
Based on my plan, I think this will be the last of the foundation posts in this series, and it’s the one I’ve put off longest, because it’s the only one where I’m clearly still the patient rather than the doctor. My investing philosophy says, in belief #5, that I am the largest single risk in my own portfolio. Within this blog article, is me, trying to put a number on that sentence … because, why not?
First, a question I got badly wrong
Since 1871, the US stock market, dividends reinvested, measured in purchasing power, has spent a certain share of its months below a level it had already reached at some earlier point. Below a number it had already printed. Not crashing, necessarily, just not back yet.
What’s your guess? About a quarter of the months? Half? Three quarters?
Well, I said a quarter, and I said it confidently, because the chart of the stock market that everyone has seen goes up and to the right and the dips look like small notches in a long climb.
The answer is 76.1%. Out of 1,830 months of history, 1,393 of them — more than three in four — were spent below a high-water mark the market had already set.
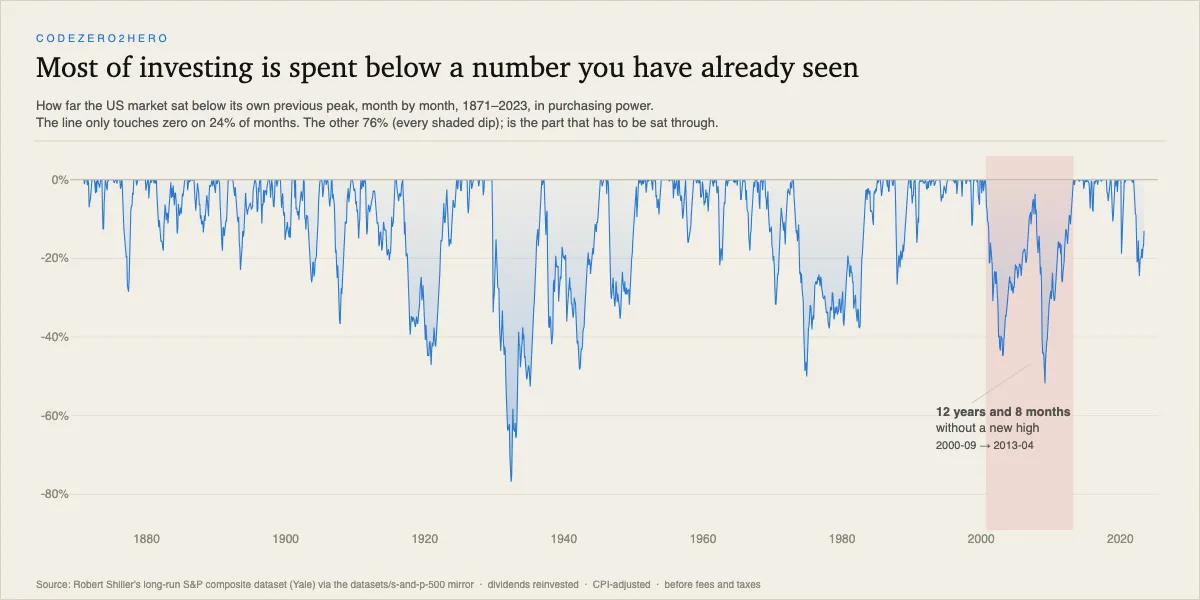
Look at where the line touches zero. That’s the entire experience of “my portfolio is at an all-time high,” and it accounts for less than a quarter of all the months there have ever been. Everything else is the shaded part.
Some of the shaded part is trivial, down 2% from last month, nobody notices. But 26.6% of all months, better than one in four, were spent more than 20% below the peak, which is the level at which newspapers start using the word bears. And the single longest stretch without a new high, marked in red on the chart, ran from September 2000 to April 2013: twelve years and eight months in which the market never once closed a month above where it had been in the summer of 2000. Not the dramatic part of a crash, but something harder to photograph: an entire career stage spent waiting to recover an old high.
That’s the number that reorganised my thinking. Not because it’s frightening, actually the market was fine, that’s what recoveries look like from inside, instead, because it tells you what the job actually is.
Remember: being below a previous high is not an unusual market emergency. Historically, it has been the normal condition. A surprising amount of investing is waiting to get back to a number you’ve already seen.
So here’s the definition I use now, and it’s deliberately not about trading: Impatience is needing the answer sooner, than the mechanism can produce it.
That’s it. It has nothing to do with how often you click. You can be impatient while doing nothing, quietly deciding, in month fourteen, that this isn’t working. And you can trade weekly and not be impatient, if weekly is genuinely the clock of the thing you’re doing (it usually isn’t, and my view about this already exists). Impatience is a mismatch between your deadline and the machine’s.
What the mismatch costs, in dollars
Opinions about patience are free, thus I built the smallest honest test I could come up with.
Take the same boring plan from the philosophy post: \$500 a month, in constant purchasing power, into the whole market, for thirty years. Run it through every completed thirty-year window since 1871, that is 1,471 of them, and that’s the patient saver.
Now run three impatient ones alongside. They do exactly what a reasonable, sensible person says they’ll do:
- “I’ll step out when it gets choppy.” Sells everything when the market is 10% below its peak, comes back six months later.
- “I’ll only move for something serious.” Sells at −20%, comes back after a year.
- “I’ll get back in when it’s clearly recovered.” Sells at −10%, comes back when the market makes a new all-time high.
Every one of them keeps contributing \$500 a month while sitting in cash, and every one of them comes back. On schedule, without fail. They pay no commission, no spread and no tax on the way out or the way in, and they never once lose their nerve and stay out an extra year. To make this work, I gave impatience every advantage I could think of, and I gave cash a real return of exactly zero. That’s a simplifying assumption, not a claim that cash always earns zero after inflation; I rerun that assumption later.
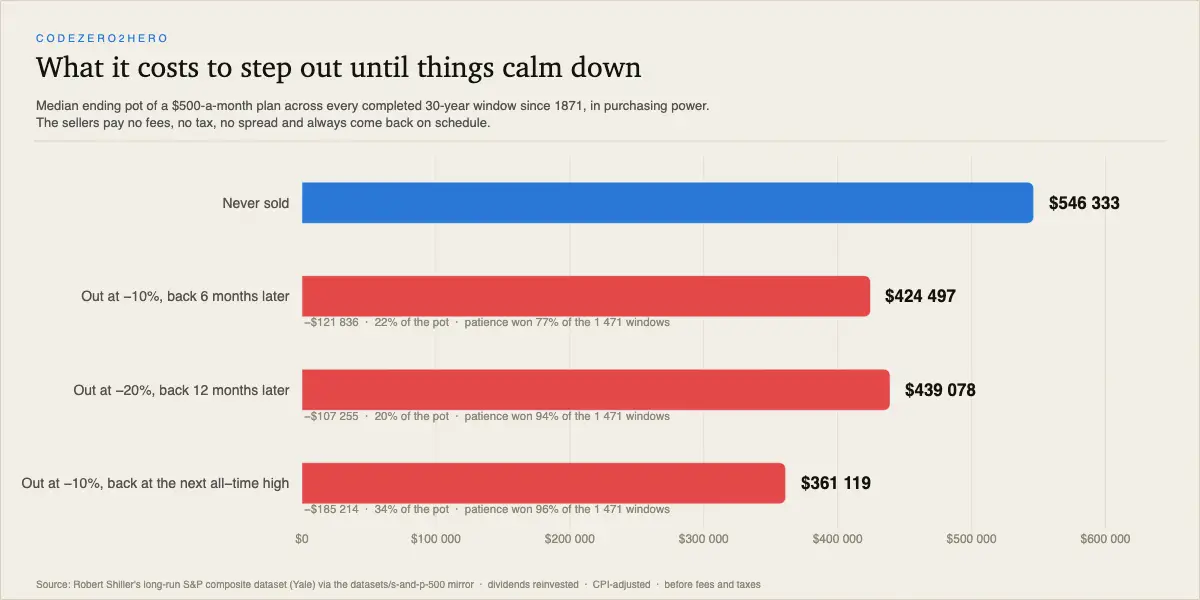
In the end, the patient saver’s median ending pot is \$546,333 of purchasing power, from \$180,000 contributed.
Stepping out at −20% and coming back a year later costs \$107,255 which is a fifth of the pot and loses to patience in 94% of the 1,471 windows. Stepping out at −10% and waiting for a clear recovery costs \$185,214, a third of everything, and loses in 96% of windows. The gentlest rule, out at −10% and back in six months, still costs \$121,836, though it’s the only one with a respectable failure rate: patience won “only” 77% of the time, which is an honest reminder that sometimes stepping out did work. Roughly one time in four, the catch … nobody knows which four.
Here’s the comparison that actually got me, though. In the philosophy post I worked out that an ordinary 1%-a-year fund fee, the invisible kind, the kind investors argue about at length in forums, removes \$94,121 from the same median plan, about 17% of the pot, … skadoosh.
Stepping out at −10% and waiting for a clear recovery costs twice that. Same plan, same market, same person. One of those decisions is made once, sober, on a form. The other is made repeatedly, at night, in a mood. We spend our comparison energy on the first one.
And if you’d like the price in the currency people actually care about — skill — the script computes that too. To end up where patience ended up, the “back at the next all-time high” saver would need to beat the index by 2.39 percentage points a year, every year, for thirty consecutive years. The mildest rule still needs +1.85%/yr. Not in a good decade. In all of them, including the ones where they were sitting in cash.
That is the whole argument of this post in one number. Patience isn’t a nice-to-have that makes the returns slightly better. It is worth more than any realistic amount of cleverness, and it’s available, to you, to me, to a complete beginner on day one, for free, without reading a single annual report.
Remember: you can’t buy two and a half points of annual outperformance. You can, in principle, just not sell. The second one is cheaper and more reliable, and almost nobody does it.
Temperament, not intelligence
The behaviour gap is the classic evidence here, so let’s do it properly, including the part that undercuts it.
Morningstar publishes a study called Mind the Gap that compares two numbers for the same funds: the fund’s own total return, and the return earned by the average euro actually invested in it, which depends on when investors put money in and took it out. In the 2026 edition, covering the ten years to 31 December 2025, the average dollar in US funds and ETFs earned 8.7% a year while the funds themselves returned 9.9%. A gap of 1.2 percentage points, about 12% of the aggregate return, roughly \$3.8 trillion of outcome that existed inside the products and did not end up in the investors.
The interesting part isn’t the headline. It’s the breakdown. US equity funds: a 0.4-point gap. The plain large-blend category, the closest thing to “just buy the index and go away”, showed essentially no gap at all. Alternative funds: 1.6 points. Sector equity: 1.2. ETFs as a whole: 1.6 points, worse than old-fashioned open-end funds at 1.2, which is at least an uncomfortable result for a product whose liquidity makes it very easy to turn a long-term holding into a short-term decision.
The gap isn’t a tax on stupidity. It’s a tax on how interesting the product is. The more a thing invites a decision, the more decisions people make, and the decisions are what costs the money.
(Honesty note, and it’s a big one: this study is contested. A paper in the Financial Analysts Journal in May 2026 — Fulkerson, Jordan, Riley and Yan Bad Timing Does Not Cost Investors 15% of Their Funds’ Returns: An Examination of Morningstar’s “Mind the Gap” Study, re-ran Morningstar’s own data and concluded that poor timing costs fund investors about 0.10% a year, not 1.2%, and that most of the observed gap is an artefact of when money happened to arrive rather than of investors behaving badly. I think they’re probably right that the famous number is overstated. That’s why the dollars in the previous section come from a simulation whose code I can hand you, rather than from a study I can only quote.
The other half of “temperament, not intelligence” is easier to demonstrate, because the smartest people in the history of finance have supplied the examples themselves.
Long-Term Capital Management had Myron Scholes and Robert Merton on its books, both of whom won the Nobel prize in economics in 1997. The fund lost around \$4.6 billion in roughly four months of 1998 and had to be recapitalised with about \$3.6 billion by fourteen institutions convened by the New York Fed. The uncomfortable detail is that the fund’s positions were, in a lot of cases, eventually fine. LTCM wasn’t wrong about the world, actually they were wrong about the calendar. Leverage and margin calls had imposed a deadline on being right, and being right after the deadline is the same thing as being wrong and like this another one bites the dust.
(Isaac Newton and the South Sea Bubble is the story everyone tells here bought, sold at a profit, watched it keep going, bought back near the top, lost a fortune. I like it, and I’d note that the tidy version has been repeated far more often than it’s been sourced.)
This is why “no leverage, not clever leverage either” sits in my written rules with no falsification condition attached. Leverage, borrowed money, a deadline, someone else’s capital, a bill due in March, these are all machines for converting eventually right into bankrupt now. They take patience off the table as an option, and patience was the only edge I was sure I had.
You can’t skip the bad part without skipping the good part
Here’s the objection I kept making to myself, and it’s a good one. Fine, but I’m not trying to sell at random. I’m trying to sit out the obviously bad stretches. Surely somewhere between “never sell” and “day trade” there’s a sensible person who just avoids the disasters?
The reason that doesn’t work has nothing to do with your judgement, when it’s structural.
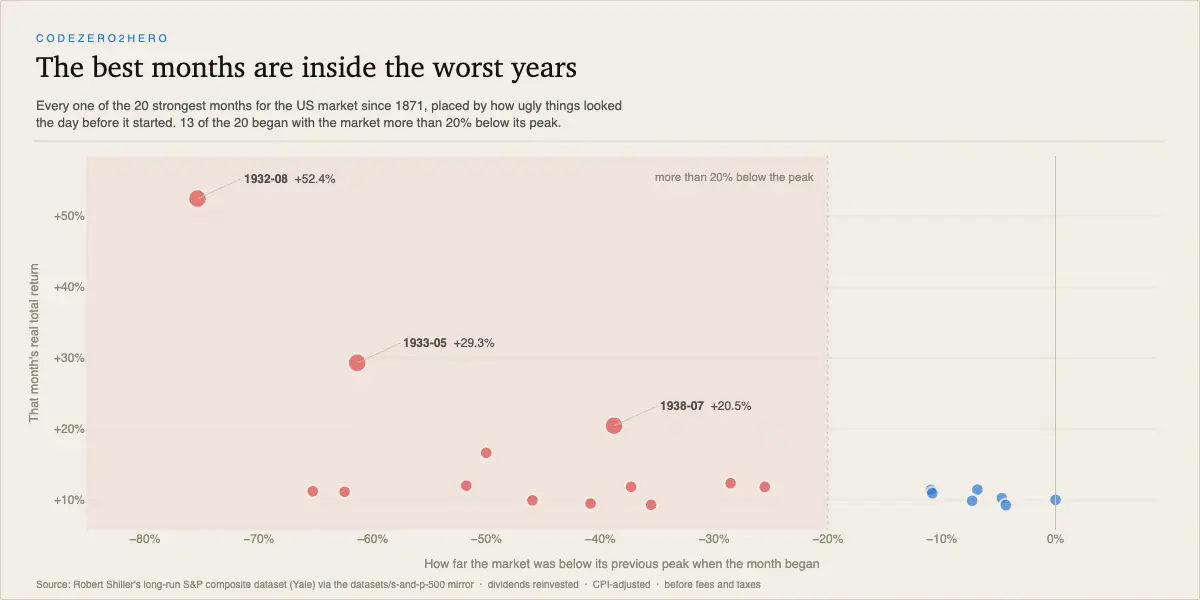
Those are the twenty strongest months in the last century and a half, placed by how ugly things looked the day before each one started. Nineteen of the twenty began with the market already below its previous peak. Thirteen of the twenty began with it more than 20% below, the median top-twenty month began with the market 36.4% underwater.
The single best month in the dataset is August 1932: +52.4% in real total return, in thirty-one days, arriving when the market was 75.4% below its peak and the Depression had another decade to run. There was certainly no clean bell announcing that the turn had arrived, and no reason an investor living through 1932 had to feel convinced. Ten of the twenty best months landed within a year of one of the twenty worst months. They aren’t separate events you can sort into good and bad, they’re the same weather.
Which means missing them is cheap to do and expensive to have done. Blank out just the three best months of your own thirty-year plan, leave everything else identical and the median pot drops by \$134,355, a quarter of the total. Six months: 36% gone. Twelve months, out of three hundred and sixty: half the pot.
You do not need to be unlucky to miss those months. You only need to be out of the market during the part that feels worst, which is exactly when they happen.
Remember: the recovery doesn’t send an invitation. It happens while the news is still bad, and if you’re waiting for the news to improve first, you’ve already agreed to miss it.
Why beginners get this wrong (I was this beginner)
Doing nothing doesn’t feel like doing the job. You’ve decided to take investing seriously, you’ve read things, and the plan’s instruction for this month is: nothing. So you invent work, you rebalance something. You “take a bit off the table.” The activity is the symptom; the real problem is that the plan gives you no score for years, so you adopt the only scoreboard that updates today’s number which gets you to start optimising the wrong thing.
Impatience arrives dressed as its opposite. It almost never says “I’m panicking.” It says I’m being prudent, I’m de-risking, I’ll just wait for clarity, I’m rotating into quality. My favourite version was my own: a META position I’d bought on a story became a “long-term investment” somewhere around −40%. That’s the same failure wearing the patience costume and both replace a written reason with a feeling one sells, one holds, neither has done any analysis.
Everyone else’s clock is faster, professionally. Financial media publishes daily because publishing is a daily business, not because investing is. A five-year thesis produces roughly one piece of content in five years, which is a terrible business model and an excellent investment process.
And in Romania, the tax code now prices the gap for you. From 1 January 2026, gains on securities sold through a Romanian intermediary are taxed at 3% if you held for more than a year and 6% if you held for a year or less double, for the same gain, purely as a function of your holding period. Dividends went to 16% at the same time. I’m not going to pretend a three-point spread is what should keep you invested. But it is a rare case of the law and the arithmetic pointing the same way, and it’s not nothing.
So when is selling actually right?
The obvious question, and the answer is short.
Sell when the reason you wrote down stopped being true. That’s the whole test, and it’s why the reason has to exist in writing before you buy a thesis you can’t quote can’t be broken, which means it also can’t be defended.
The practical filter is one question: did new information arrive, or only a new price? Price matters for valuation, obviously, but a lower quote by itself does not tell me that the business thesis broke. Earnings collapsing, the moat leaking, management allocating capital in a way I’d have voted against, those are new information. Down 30% is a new price, for which I still need a business reason before I turn it into a new thesis.
Two honest exceptions. Your life is allowed to change the plan: money that acquires a deadline should leave the market, regardless of the chart. And holding a genuinely broken business because selling would make the loss feel real isn’t patience, it’s the same avoidance running in reverse. Patience attached to no thesis is just paralysis with better PR.
Where this argument is weak
The impatient savers are caricatures. Nobody sells at exactly −10.0% and returns exactly six months later. Real behaviour is messier and, I suspect, worse: people sell late, after the fall has already happened, and return later than any rule I coded, due to FOMO or purely because buy the deep, … which deep, you will find out. But real behaviour also includes something I didn’t model at all, people who don’t sell, they just quietly stop contributing. That might be the more common failure, and it isn’t in these numbers.
Cash at zero real return is an assumption, not a fact. Rerun it with cash earning 1% a year in real terms, generous, historically and the gaps shrink to between \$83,936 and \$139,045. Smaller, yes but still enormous.
It’s one country’s history, counted generously. All 1,471 windows come from the US, and they overlap heavily, so there are only about five genuinely independent thirty-year periods hiding inside that impressive-sounding number. The same objection I made in the casino post applies here and always will.
Patience is not a virtue on its own. It’s an amplifier. Patience attached to a global index fund is the cheapest edge available to a beginner. Patience attached to leverage, or to a concentrated position you can’t explain in three sentences, or to a business whose thesis has quietly died, is just a slower and more dignified way to lose money. Everything in this post assumes the thing you’re being patient with is something that compounds. (How much of any one thing you should own before patience becomes stubbornness is Position Sizing, which three posts now owe you, including this one.)
And I haven’t been tested. I’ve never held a real portfolio through a real −40%. Every rule below is a hypothesis about my own future behaviour, which is the least reliable kind of hypothesis there is. Ask me after the first one. (The plan for that day is its own post — My Market-Crash Plan — and writing it while nothing is happening is the entire point.)
My current rule
Three lines, in the same notebook as the rest:
- A position changes because the thesis changed, not because the quote made me uncomfortable. Price can change valuation and expected return. It does not, by itself, tell me that the business changed.
- The sell condition gets written before the buy is placed. If I can’t finish the sentence “I will sell this if ___,” I don’t understand the position well enough to own it, and the honest move is the index instead.
- I put decisions on a calendar instead of letting the market schedule them for me. Monthly investing has a date. Portfolio reviews have dates. A bad Tuesday does not get to invent a new meeting.
Changes my mind: if I find myself following all three and still reaching for the app during a bad week, the rules aren’t the problem, the position sizes are. Something I own is too big to be held calmly, and the fix is arithmetic, not willpower.
Your turn
Three things, none of which require you to buy anything.
- Run the numbers with your own plan.
impatience.pytakes a monthly contribution and a horizon, and prints what each version of stepping out would have cost across 1,471 historical windows. Put your actual number in.$500is my plan, possibly not yours. - Count your logins for one week, not your trades. Just the number. That figure is your real relationship with your portfolio, and it’s the one number in investing nobody publishes about themselves. If it’s larger than the number of decisions your plan actually requires per year, the gap is the thing this whole post is about.
- Write your sell condition for everything you currently own. Today, while nothing is happening, which is the only time anyone can think clearly. Anything you can’t finish the sentence for is a position you’re holding on a feeling.
Then write down the date your plan is allowed to be judged. Mine is 2046.
That does not mean I ignore the next twenty years. I still read filings, revisit theses and admit when I was wrong. It means I am trying to stop using today’s price as a daily referendum on a plan built for decades.
Everything between now and then is weather, and the single most valuable skill I’m trying to build is the ability to sit through weather without calling it a forecast.
The market will hand you the returns. It just won’t hand them to you on your schedule, and it has never, in more than a century and a half, made an exception for someone who was in a hurry.
Behind the scenes: what the numbers are made of:
Everything is quoted in dollars, because that is the dataset’s native unit, it is a US index, priced in US dollars, deflated by US CPI. Earlier posts in this series ran the same simulations and printed the results with a euro sign, which quietly implied an exchange rate I never modelled. Dropping it costs nothing and removes one thing I’d otherwise have to apologise for. If you invest from Romania in euros or lei, add currency drift on top of every number here, in either direction; that gets its own lesson.
The data itself runs on Robert Shiller’s long-run S&P composite dataset (Yale), fetched from the free
<code>{=html}datasets/s-and-p-500</code>{=html} mirror — the
script tries three hosts of the same file (GitHub, jsDelivr, datahub)
and keeps a local cache, because GitHub sometimes greets direct visits
with a rate-limit error. Monthly since 1871: price, dividends, earnings,
CPI. Dividends are reinvested at one-twelfth of the annualised rate each
month and the whole series is divided by CPI, so every dollar quoted is
a dollar of purchasing power.
Fine print that honest readers deserve. Shiller’s monthly “price” is the average of that month’s daily closes, which smooths the series, it makes single-month extremes slightly less extreme than they were in daily reality, so the August 1932 figure is, if anything, understated. The dividend and CPI columns lag price by a couple of years, so the total-return series runs 1871 to June 2023 and the last complete thirty-year plan starts in July 1993; nothing here speaks to how the last three decades of starts will turn out. The 1,471 windows overlap heavily and are not independent observations.
The impatience rules trigger on the drawdown of the index from its own peak since the plan began, not on the saver’s personal portfolio value close enough with monthly buying, and it’s the number a real person would actually see quoted at them. Order of operations inside each month: observe the price, act on it, then contribute. Portfolio value is measured immediately after the final purchase, which slightly understates every ending, patient and impatient alike. Sales and repurchases happen instantly at the index level with no spread, commission or tax, and the sellers never fail to return, all of which flatters impatience.
The “break-even skill” figure is a bisection search: it finds the constant annual outperformance, applied as a smooth monthly boost to the index itself, that lifts an impatient saver’s median ending pot to the patient saver’s. The famous “missing the ten best days” statistic is usually computed on daily data; this dataset is monthly, so the equivalent here is missing the best months, which is a stingier and more conservative version of the same test.
Every figure quoted above is printed by the script, and
impatience_table.csv contains all 1,471 windows with the ending value
under each rule, so you can check the medians yourself rather than
taking mine.
Companion code:
impatience.py
fetches 150+ years of monthly market data, computes the underwater
statistics, runs the \$500-a-month plan through all 1,471 completed
30-year windows under four behaviours, solves for the break-even skill
each one would need, locates the twenty best months, writes
impatience_table.csv, and renders all three charts. Figures are
CPI-adjusted total returns for the S&P composite, 1871–2023, dividends
reinvested, before fees and taxes. Morningstar’s *Mind the Gap 2026*
figures are as published by Morningstar; the Financial Analysts Journal
critique is Fulkerson, Jordan, Riley & Yan, May 2026. Past frequencies
are not promises. This is education, not investment advice, I’m a
student of this, learning in public.*
Read next:
- Prerequisite: The Dip I Kept Waiting For > why waiting for the right entry is its own bet. This post is what happens after you’re already in.
- Related: My Investing Philosophy > belief #5, where I named myself as the largest risk in the portfolio — and The Market Is Not a Casino > the holding period that decides which game you’re playing.
-
Continue with: Why I Need a Process Before I Need Stock Picks > patience is the temperament; a process is what gives it something worth being patient about.
-
Tool:
impatience.py+impatience_table.csv> the price of every version of stepping out, across 1,471 thirty-year plans.
Comments
0