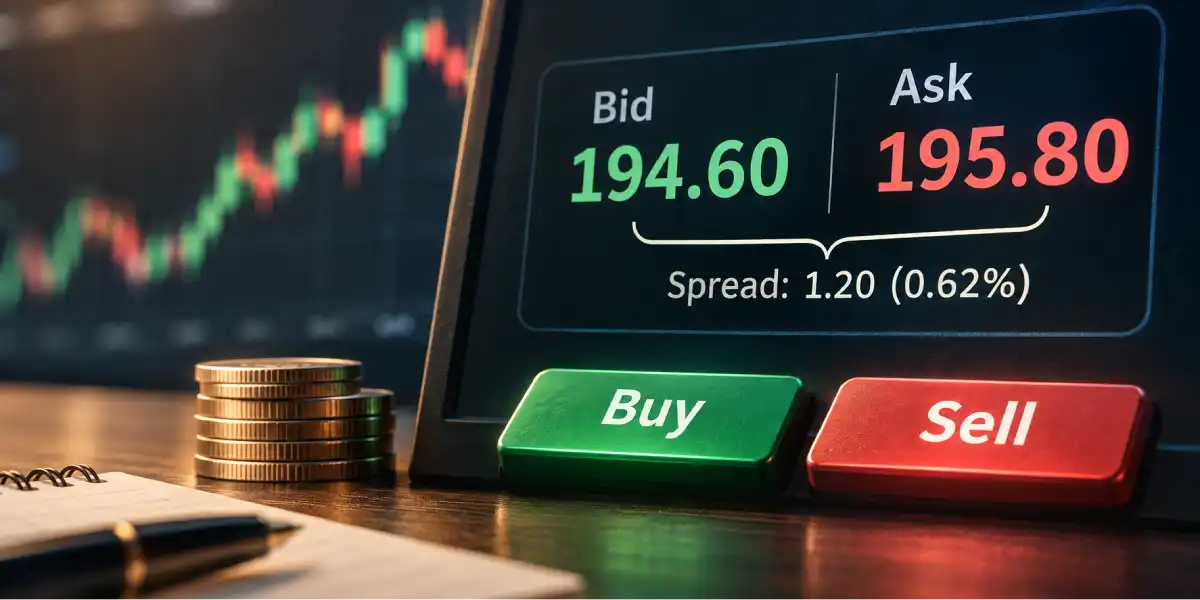
Every app I’ve ever used shows me one price. One big number, green or red, next to the ticker.
That number is a lie of convenience, in reality there isn’t just one price. At any given moment, someone is willing to buy at one price and someone else is willing to sell at another. If I insist on buying now, I usually pay the higher one and if I insist on selling now, I usually accept the lower one.
The difference is a trading cost, it doesn’t arrive as a line item on my broker’s statement, which makes it rather easy to forget.
I wanted to know what that gap looked like in real stocks, not just in a textbook. So on Sunday, 15 November, I opened my broker’s data feed and pulled quotes for seven US instruments, from SPY to a couple of names most people have never heard of.
The smallest quoted round-trip spread was 0.019%, were the largest was 23.8%. Same broker, same snapshot, a gap of more than a thousand times.
There’s one catch, and I’ll come back to it properly: the US market was closed, so these were frozen quotes, the last values the feed recorded on Friday. That makes the expensive end of the list a warning about what happens when liquidity disappears, not an estimate of what those stocks cost to trade on a normal afternoon.
The below story is about that gap: what it is, why it exists, why it sometimes barely matters and sometimes matters a great deal, and how to check it before I click either BUY or SELL.
A quick question first
Two stocks, two quotes:
- Stock A trades around $355. Bid $355.33, ask $355.40. The spread is 7 cents.
- Stock B trades around $1.37. Bid $1.37, ask $1.38. The spread is 1 cent.
Which one is cheaper to trade?
The one-cent spread looks like the obvious winner, after all, 1 cent is less than 7. But in reality, it’s A, and not by a little. Stock A has a quoted round-trip spread of about 0.02% of its price. Stock B is at 0.73%. With the same amount of money at stake, B’s quoted spread is roughly 37 times larger in percentage terms.
A is Apple. B is SNDL. Keep that comparison in mind, because it’s the whole article in miniature: the spread only becomes meaningful when you compare it with the price, cents on their own, will tell you very little.
What the spread actually is
For an actively quoted stock, the market normally shows two prices.
The bid is the highest displayed price a buyer is offering. Sell immediately and that’s the price you can expect, as long as enough shares are wanted there.
The ask (or offer) is the lowest displayed price a seller is requesting. Buy immediately and that’s the price you can expect to pay, again as long as enough shares are on offer.
The spread is ask minus bid where the mid is halfway between them. The mid is a useful reference point, not some magical fair value. Trades can execute at the mid or inside the spread, but a marketable order can’t count on it. Taking the displayed liquidity usually means crossing the spread.
Here’s one quote for Arista Networks, a company I’ve written about before and one that sits comfortably inside my own circle of competence:
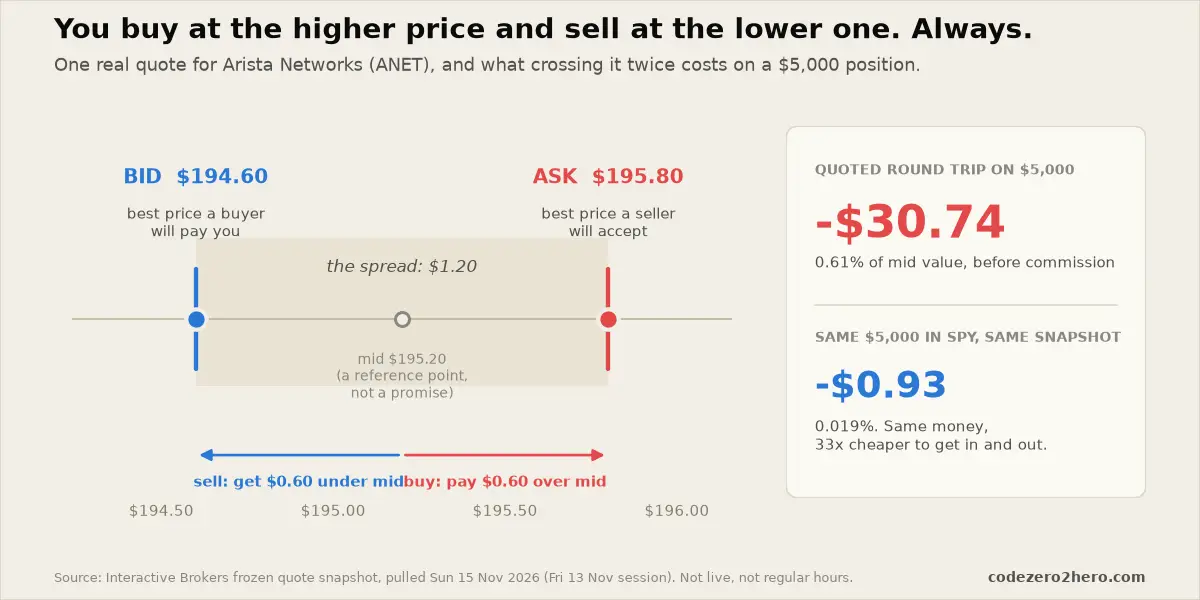
The bid was $194.60, the ask $195.80, this means a $1.20 gap on a stock priced around $195.
The chart turns that into $30.74 on a $5,000 position valued at the mid. The same calculation for SPY gives $ 0.93and that’s the scale of the difference.
One accounting detail. If I literally spend $5,000 at ANET’s ask and immediately sell every share at the bid, I get back about $4,969.36, a loss of $30.64. The chart’s $30.74 is measured from the mid, so it’s a close estimate, not an exact cash-flow statement. On very wide spreads that distinction gets much bigger and I will run both calculations further down the story.
Measured from the mid, buying at the ask costs half the spread and selling at the bid gives up the other half. Together, those two halves make the quoted round-trip spread. It’s not a broker fee, exactly, it’s the implicit price of demanding immediate execution.
Remember: the big price on the screen is often a last-traded price, not a promise that I can buy or sell there. I want to see the actual bid, ask and available quantity before placing an order.
Who’s on the other side, and why they charge you
The spread isn’t a scam, and it isn’t automatically money my broker pockets.
Market makers and other liquidity providers post bids and asks so that there are buyers and sellers available even when I don’t want to wait, that’s useful. Without people willing to quote prices, every order would have to hunt around for someone on the other side.
Why isn’t the gap zero? Two risks explain most of it:
- Inventory risk. If a market maker buys my shares and the price falls before it can sell them, it loses money.
- Adverse selection. The other trader may have better or faster information. If a stock is about to move, standing on the wrong side of that trade is expensive.
Market makers try to earn the spread, but they don’t automatically keep all of it. Competition, hedging, fees and price movement all eat into what they actually make. Other investors posting limit orders supply liquidity too.
The basic intuition holds: when a stock is thin, volatile or hard to hedge, standing ready to trade it gets riskier, and the spread widens. Which brings me to the chart that started this article.
Seven real quotes, one snapshot
Here’s every quote I pulled, sorted from the smallest to the largest quoted round-trip spread:
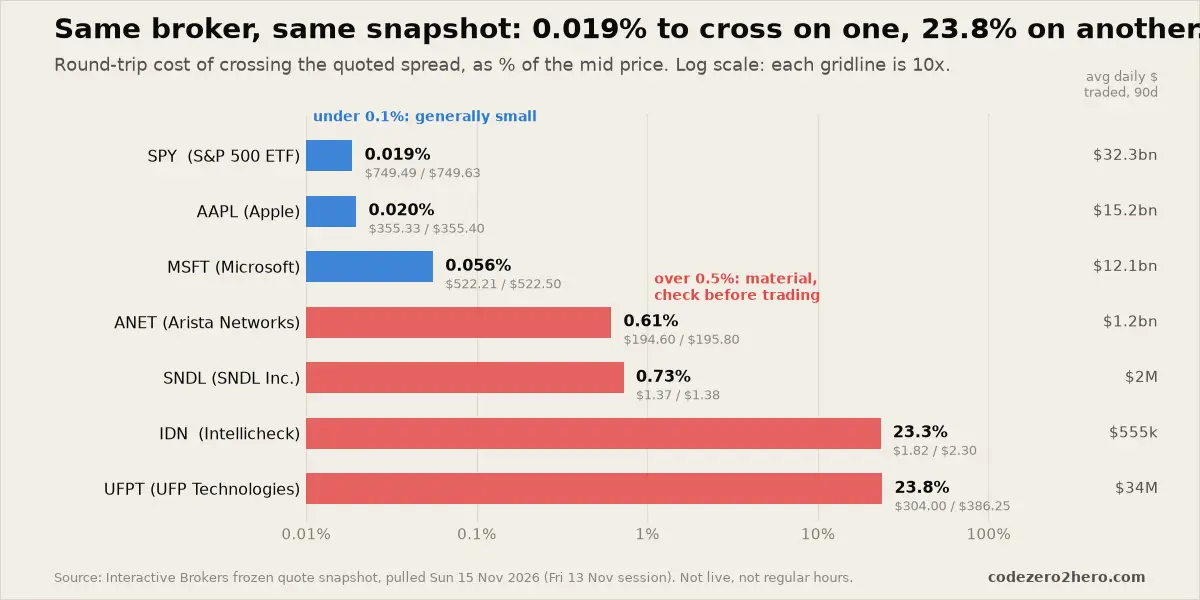
A few things jump out.
SPY, Apple and Microsoft stayed tight. SPY at 0.019%, Apple at 0.020%, Microsoft at 0.056%. On a $10,000 position valued at the mid, SPY’s quoted round trip works out to about $1.87. Small, though not free.
The right-hand column matters. It’s the average dollar value traded per day over the previous 90 days, according to the feed. SPY trades around $32 billion a day; Intellicheck around $555,000. Trading activity isn’t the whole story, but more liquidity usually means more competition to provide quotes and more depth behind them.
ANET is the odd one out. It trades more than $1 billion a day on average, yet its frozen quote was 0.615% wide. My first reaction was that something must be wrong. Then I remembered what time the data came from. I’d expect a much tighter quote in a busy regular session, but I didn’t collect that data, so I can’t say how much tighter.
UFPT and IDN are warnings, not cost estimates. UFPT showed a $304 bid and a $386.25 ask: a 23.8% spread that looks almost ridiculous, and probably reflects a thin, stale book at the end of extended trading. A frozen ask isn’t an order you can hit on a Sunday. But if a quote that wide were live and reachable, a market buy order would fill at it. That’s the real lesson from the bottom of the chart.
The catch: these are frozen quotes
I pulled the data on Sunday, 15 November 2026. The IBKR feed marked all seven US quotes FROZEN: the last values it had recorded while the market was open. The last-trade timestamps run from 21:04 UTC on Friday, 13 November, to 00:59 UTC on Saturday, 14 November. Those are last-trade times, so the bids and asks aren’t guaranteed to be from exactly the same second.
I nearly threw the data away and waited for Monday. I kept it because it shows something a clean regular-hours sample wouldn’t: how unreliable “the spread of a stock” becomes once liquidity leaves.
During regular hours, State Street’s SPY fund page shows a 30-day median bid/ask spread rounded to 0.00%, not literally zero, just very small at that precision. At the other extreme, thin extended-hours books can look absurd.
For anyone placing US orders from Romania, the clock matters. The regular US session is 09:30 to 16:00 New York time, usually 16:30 to 23:00 Bucharest time. The US and Europe switch daylight saving on different dates, so for a couple of weeks around March and October that shifts by an hour. Check the exchange session, not just the clock.
Many brokers also accept only limit orders outside regular hours. So a wide quote you see isn’t necessarily one you can reach. That doesn’t make the risk imaginary, it means you need a live quote to know the risk you’re actually taking.
Remember: a spread isn’t a fixed property of a stock. It’s a property of the market at a moment, on a given venue, for a given order size. Same stock, different hour, very different cost.
Why a one-cent spread can still be expensive
Back to SNDL, how can a one-cent spread be so expensive?
Because for US exchange-listed stocks priced at $1 or more, the minimum quoting increment is one cent. It’s called a tick. If the best bid and ask are one tick apart, the percentage spread is roughly one cent divided by the share price:
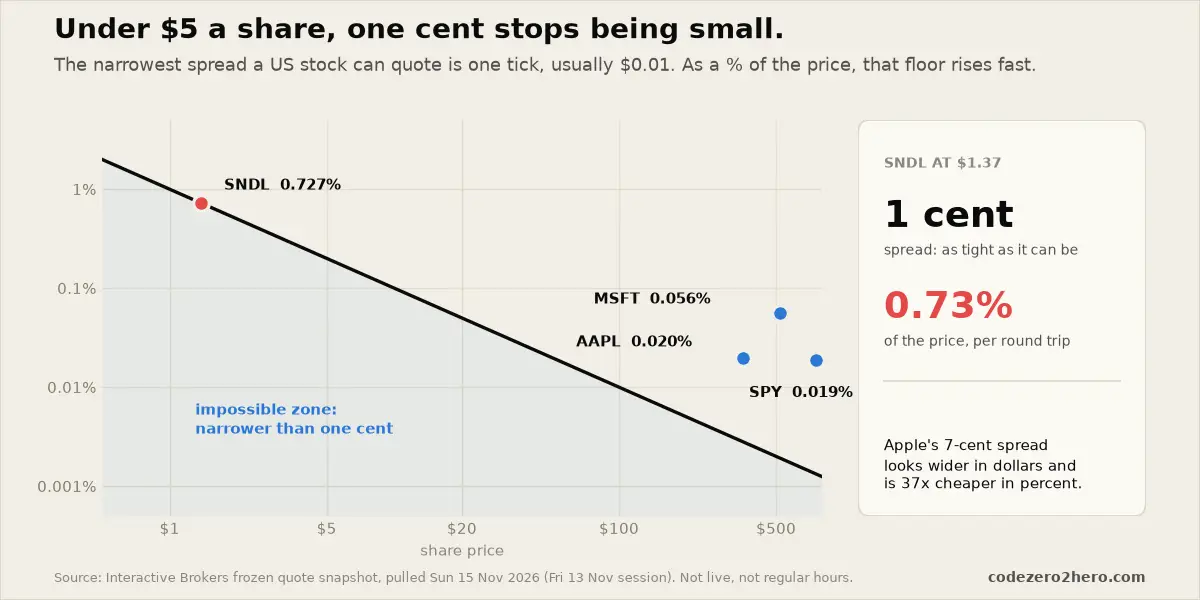
At about $1.375, one cent is 0.727%. SNDL was exactly one tick wide in this sample: as tight as its quote is allowed to be, and still expensive relative to the price.
At about $355, one cent is roughly 0.003%. Apple’s quote was seven cents wide and still about 37 times tighter in percentage terms than SNDL’s.
This is the trap in the phrase “cheap stock”. Buying 1,000 shares of a $1 stock can feel more exciting than buying three shares of something expensive, but the share count has nothing to do with the cost of getting in and out. A $1 stock quoted one cent wide carries a quoted round trip of about 1% before any other cost.
Two details worth getting right. Below $1, US stocks can be quoted in increments as small as $0.0001, so the one-cent floor doesn’t extend down there. And the SEC adopted a half-cent tick for certain very liquid $1-plus stocks in 2024, but in June 2026 delayed its implementation until November 2027. For now, one cent is the floor that applies to these quotes.
None of this says every low-priced stock is a bad investment. It says a low share price doesn’t mean low trading costs. If anything, it sets a surprisingly high minimum.
The real damage: frequency
So far, many of these numbers sound small. 0.6% here, 0.02% there so who cares?
Anyone who keeps crossing the spread.
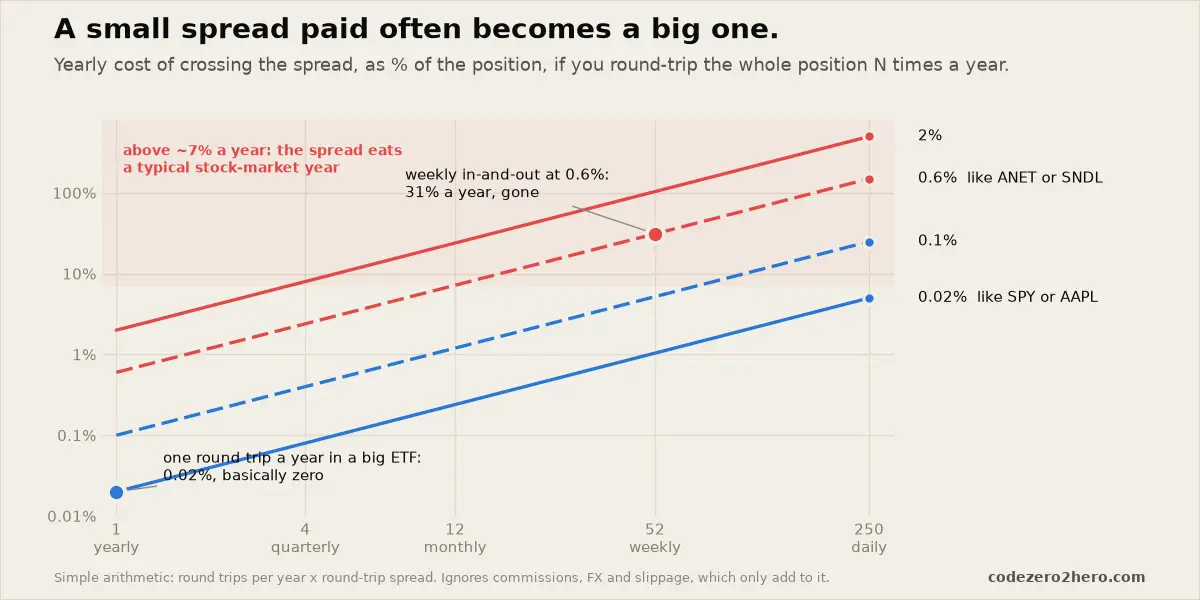
The arithmetic is simple: round trips per year × quoted round-trip spread, assuming the whole position is turned over each time.
Trade in and out of something with a 0.6% spread every week and that’s 52 × 0.6% = 31.2% of one position’s value over a year. It’s not a forecast that an account loses exactly 31.2%: returns, position sizes and spreads all change along the way. It’s a measure of how much turnover can cost under a deliberately simple assumption.
For comparison, long-run US stock returns are often quoted at roughly 7% to 10% a year, depending on the period and whether you mean real or nominal. The two numbers aren’t directly comparable, but the point survives: a strategy earning 8% gross can’t carry a 31% yearly trading-cost burden on the same capital.
This is the part of the casino comparison I hadn’t fully appreciated when I wrote The Market Is Not a Casino, but You Can Use It Like One. The market isn’t a casino with a fixed house edge. But a small execution cost, repeated often enough, quietly becomes the main expense.
For someone buying a broad, liquid ETF a few times a year and holding it, the spread is almost irrelevant next to the investment decision itself. For a short-term trader, or anyone trading thin names, the arithmetic gets uncomfortable fast.
Remember: it’s not just how wide the spread is. It’s how many times you pay to cross it.
“Zero commission” doesn’t mean zero cost
This is where brokers come into it.
Some US brokers receive payment for order flow ( PFOF): compensation from a market maker for routing customers’ orders to it. That’s how a broker can advertise “zero commission” and still earn money from your trades.
The next sentence needs care. PFOF doesn’t automatically mean you pay a wider spread, and the market maker doesn’t necessarily pocket the whole quoted gap. US orders often get price improvement, a fill slightly better than the displayed bid or ask. The real issue is whether the routing incentive conflicts with the broker’s duty to get you a good execution, not whether every free trade is secretly marked up by a fixed amount.
In the EU, MiFIR Article 39a bans PFOF. The transitional exemption for member states that still allowed it, Germany included, ended on 30 June 2026, so from 1 July 2026 it’s gone.
Goodie we can say, but the spread doesn’t disappear because one revenue model is banned. The venue, the depth of its order book, the time of day, commissions and FX conversion all still shape what a trade costs. A “free” broker that only gives me a thin quote at an inconvenient hour can be more expensive than one charging an honest commission.
So the question isn’t just “what’s the commission?” It’s “what is the total cost of my execution, compared with the price I thought I was getting?” The quoted spread is the place to start, though not always the biggest piece.
How to estimate your own round-trip cost
I don’t need a model for a first estimate. I need the bid and ask my broker actually shows, plus enough shares on offer for my order.
Step 1. Note the current bid and ask. Check that the quote is live, not frozen or delayed.
Step 2. Work out the quoted round-trip spread as a percentage of the mid:
$$ \text{quoted spread (\%)} = \frac{\text{ask} - \text{bid}}{(\text{ask} + \text{bid}) / 2} \times 100\% $$
Step 3. Multiply that percentage by the position’s value at the mid. That’s the estimate in my charts. Half of it is the buy side, half the sell side. It’s a benchmark, not two fees your broker will debit.
Here it is for the seven frozen quotes, on a position worth $5,000 at the mid:
| Ticker | Bid | Ask | Quoted round trip | On $5,000 at mid | Half-spread vs mid |
|---|---|---|---|---|---|
| SPY | $749.49 | $749.63 | 0.019% | $0.93 | $0.47 |
| AAPL | $355.33 | $355.40 | 0.020% | $0.98 | $0.49 |
| MSFT | $522.21 | $522.50 | 0.056% | $2.78 | $1.39 |
| ANET | $194.60 | $195.80 | 0.615% | $30.74 | $15.37 |
| SNDL | $1.37 | $1.38 | 0.727% | $36.36 | $18.18 |
| IDN | $1.82 | $2.30 | 23.3% | $1,165 | $583 |
| UFPT | $304.00 | $386.25 | 23.8% | $1,192 | $596 |
The last two rows show why I have to be precise about the word cost. Those are midpoint-based illustrations, not money that left anyone’s account.
If I want the exact cash loss from spending a fixed amount at the ask and immediately selling every share at the bid, the formula changes:
$$ \text{cash loss} = \text{cash spent} \times \frac{\text{ask} - \text{bid}}{\text{ask}} $$
For ANET that’s $30.64. For UFPT it’s $1,064.72, not the $1,192 in the table. And with a thin book I might not fill a whole $5,000 order at either displayed price anyway. Bid and ask size matter as much as bid and ask price.
My rough thresholds, which are personal habits, not a rulebook:
- Under 0.1%: generally small. For a modest order in a liquid name I don’t lose sleep over it, though that doesn’t make a market order automatically sensible.
- 0.1% to 0.5%: I pay attention. A limit order is usually worth it, especially if I trade the name often.
- Over 0.5%: material. I check the time, the liquidity, my order size, and whether this stock is normally quoted tighter.
- Over 2%: I stop and investigate. A stale quote, a thin venue or a closed market is the likely explanation. I won’t send a market order just to find out.
The companion script does both calculations and applies the same thresholds:
(.venv) python bid_ask_spread_charts.py calc 194.60 195.80 5000

quote: bid 194.6000  ask 195.8000  quoted round trip 0.615%
  on $5,000 at the mid:       $30.74  (half-spread vs mid $15.37)
  spend $5,000 at ask, sell at bid: $30.64 cash loss
  -> material: check time, liquidity and order size
It prints the quoted percentage, the midpoint-based dollar figure, and the exact cash loss from spending $5,000 at the ask. For liquid shares the two dollar numbers are nearly identical. At the ugly end of the table, they aren’t.
What about European ETFs?
This is the part I most wanted to measure and couldn’t. My data feed didn’t give me a usable Xetra or London Stock Exchange quote, so I have no honest VWCE or CSPX spread to put next to SPY.
Here’s how I’d check instead:
- Deutsche Börse’s ETF pages show trading information for funds on Xetra. Look up the fund by ISIN (VWCE is IE00BK5BQT80) and check whether the quote you’re seeing is live or delayed. -
The Xetra Liquidity Measure (XLM) gives an estimated round-trip cost in basis points for a given order size. It goes further than the top-of-book spread, because it accounts for the depth behind it.
- My broker’s order ticket shows the market I’m actually about to trade. I can note the bid and ask shortly after Xetra opens and again after US trading starts, on the same venue.
For UCITS (Undertakings for Collective Investment in Transferable Securities) ETFs holding US stocks, spreads often tighten once US markets open, because market makers can hedge against live US prices. But “the afternoon is always cheaper” would be too strong. The fund, the listing, the currency and the day all matter.
I’d rather admit I don’t have the data than paste in a precise-looking spread I can’t reproduce. Next time if I’ll buy one of these funds, I’ll write the quote down.
Why beginners get this wrong (I did)
The app shows one price. Most interfaces put the last trade in big friendly font. The bid and ask take digging. I can easily imagine trading for years without noticing the difference.
Thinking in cents instead of percent. A $1.20 spread on ANET sounds terrible. A $0.01 spread on SNDL sounds great. As percentages in this snapshot, they’re close: 0.615% against 0.727%.
Mistaking a frozen quote for a live market. This almost happened to me while writing this post. A screen can show two precise numbers long after those orders stopped being available.
Trading outside the busy hours. From Romania, the morning is convenient. For US shares it’s also outside the regular session, when quotes are wider or missing and some brokers won’t take the order type I want.
Ignoring frequency. A 0.5% spread paid once is manageable. Paid 50 times on the full position, it’s a different line in the arithmetic.
Using market orders on thin names. A market order puts getting filled ahead of the price. If there’s little depth at the ask, the next shares cost more. I covered that in Market Order vs. Limit Order. The spread is the first visible clue, not the whole story.
Close the obvious question: is the spread the only hidden cost?
The blunt truth, NO, it’s just the one I find easiest to see once I know where to look.
If my order is bigger than the quantity at the best bid or ask, it fills deeper in the book at worse prices. That’s market impact. More broadly, slippage is the gap between the price I expected and the price I got, whether from a thin book or the market moving while I clicked.
Then there’s FX conversion when I buy US stocks with lei or euros. Depending on the broker, that can cost more than the spread. And for an ETF there’s the expense ratio, charged inside the fund over time rather than when I trade.
I still think the spread is the right place to start. I can check it before I place the order, and it reminds me that clicking Buy is a transaction, not just an opinion about a company.
FX costs get their own post when I reach currency risk. Expense ratios get theirs share of love too, don’t worry.
Where this post is weak
These are frozen quotes, not executed trades. The biggest qualification. They show what the feed last recorded, not an executable book and not a typical regular-hours cost. That matters most for ANET, IDN and UFPT.
They aren’t perfectly time-matched. I have last-trade timestamps, not a verified common timestamp for every bid and ask. The comparison shows the range in one snapshot; it isn’t a controlled study.
One snapshot is one moment. A proper study would use many timestamped quotes across sessions, ideally with sizes and real fills. Seven quotes show the mechanism. They can’t tell you ANET typically has a 0.615% spread.
Quoted spread isn’t realised spread. Some trades fill inside the quote; others fill worse because of depth or movement. The midpoint figure is a teaching tool, which is why I put the exact cash-loss formula next to it.
No European sample. Still the obvious hole; my UCITS suggestions are checks to run, not measurements.
I’m not a market maker. I’ve never quoted a market in my life, also didn’t had the pleasure to work in one. This is what I’ve understood from reading and from checking my own broker. If someone who does this professionally spots an error, I’d rather fix it with a dated note than leave a neat sentence in place because it sounds good.
My current rule
- I check the bid and ask before every trade. Not the big last-traded price, and I check the quote is live.
- I convert the gap to a percentage. A penny tells me nothing on its own.
- Over 0.5%, I use a limit order and ask whether I need to trade at all. Under that, it depends on liquidity, size and how urgently I need the fill. Usually when you invest for longer, urgency should not be here.
- For US stocks, I trade in the busy part of the regular session. In November that’s roughly 17:00 to 22:30 Bucharest time. When the daylight-saving calendars drift apart, I check the session.
- For US-heavy UCITS ETFs, I check the afternoon quote too. I don’t assume it’s better without comparing it with the morning, on the same venue.
- I count trades, not just costs. If I keep crossing the same spread every few weeks, frequency is the thing to fix.
What would change my mind: a broker that showed me a reliable all-in execution cost before I confirm (venue, live bid and ask, depth, fees and FX). I’d still care about the investment, but at least the plumbing would be visible.
Your turn
Three small things. Maybe ten minutes.
- Find the bid and ask in your app. Pick something you own. See whether the app shows both numbers, a quote time and the exchange. If it doesn’t, that’s worth knowing about your broker.
- Calculate the quoted round trip. Use the formula above. Look at your order size too, because a thin quote might not cover it.
- Check it twice on a trading day. For a US stock, once during the regular session and once outside it, if your broker shows both. For a US-heavy UCITS ETF, once in the morning and once after the US open, on the same venue.
None of this will help me neither you, pick better companies. Hope it will stop us from leaking money on the way in and out of the ones we’ve already picked.
Over a lifetime of investing, that leak is worth plugging.
Quotes. Pulled with the Interactive Brokers market data snapshot (bid_ask, last, top_status,
avg_90d_usd_volume) on Sunday 15 November 2026. The market data status for every US quote was FROZEN: the last
recorded quote, not a live one. Last-trade timestamps run from 21:04 UTC on 13 Nov (IDN) to 00:59 UTC on 14 Nov (SPY,
AAPL, MSFT). The quotes:
| Ticker | Bid | Ask | Avg daily $ traded (90d) |
|---|---|---|---|
| SPY | 749.49 | 749.63 | $32.3bn |
| AAPL | 355.33 | 355.40 | $15.2bn |
| MSFT | 522.21 | 522.50 | $12.1bn |
| ANET | 194.60 | 195.80 | $1.2bn |
| SNDL | 1.37 | 1.38 | $1.8M |
| IDN | 1.82 | 2.30 | $0.55M |
| UFPT | 304.00 | 386.25 | $34.5M |
Two cost measures. Quoted round trip, measured from the mid: (ask − bid) / ((ask + bid) / 2). Exact cash loss from spending a fixed amount at the ask and selling at the bid: cash × (ask − bid) / ask, my script prints both.
SPY regular-hours spread. State Street’s SPY fund page, 30-day median bid/ask spread shown as 0.00% (rounded), alongside market data as of 12 Nov 2026.
Tick size. US stocks priced at $1 or more quote in $0.01 increments; below $1, increments can be as small as $ 0.0001. The SEC’s 2024 half-cent tick for very liquid $1-plus stocks was delayed in June 2026 to the first business day of November 2027 (statement by Chairman Atkins, 11 June 2026).
PFOF. MiFIR Article 39a. The transitional exemption for member states that permitted PFOF ended on 30 June 2026.
XLM. Deutsche Börse’s Xetra Liquidity Measure expresses the market-impact cost of a round trip in basis points for a given order size.
Turnover chart. Plain arithmetic: round trips per year × quoted round-trip spread, with the whole position turned over each time. Ignores commissions, FX, slippage and taxes, all of which add to it.
Companion code:
bid_ask_spread_charts.py
draws the four figures, prints every number in this post, and works as a round-trip calculator for your own quotes.
Read next:
-
Prerequisite: Market Order vs. Limit Order. The order type decides whether you cross the spread, and how far into the book you go.
-
Related: The Market Is Not a Casino, but You Can Use It Like One, on why how often you trade matters more than any single trade.
-
Next lesson: Stocks, Bonds and ETFs (coming: choosing your vehicle before choosing what to buy).
-
Tool:
bid_ask_spread_charts.py: the four charts above, pluscalcfor your own quotes andliveto fetch current ones with yfinance.
Disclaimer: This article is part of my investing learning process. It is for educational purposes only and is not financial advice or a recommendation to buy or sell any security. Always perform your own research and verify important figures against the original company filings.
Comments
0