In this blog post I will continue my NVIDIA analysis and I will start my writing with a short note:
A quarterly follow-up to NVIDIA Q2 FY2027: The Numbers Are Getting Hard to Comprehend. Figures are from NVIDIA’s 17 November earnings release, CFO commentary, supplemental financial statements and earnings-call transcript unless otherwise indicated. The valuation uses the 17 November regular-session closing price, before the earnings release.
Three months ago, I wrote that NVIDIA had almost doubled quarterly revenue in a year, and that the bigger question was no longer whether it could sell another GPU. It was whether the economics supporting this enormous AI infrastructure buildout were durable.
Since then, the market has corrected on fears that the return on AI investment isn’t there, Jensen Huang has resigned as CEO amid an FBI investigation into his ties to a suspected Chinese spy and reports of relationships with employees, and NVIDIA has delivered an earnings call that felt read from a script (literally). The debut of new board chair Harvey C. Jones did more to raise questions than to settle them.
Yesterday NVIDIA reported $115.8 billion of quarterly revenue, a year ago, the comparable number was $57.0 billion.
I could start with another paragraph about how absurd that growth is but the more useful question, today, is what changed underneath the revenue line.
Data Center is still accelerating. Rubin has moved from a promise into shipments. Operating margins remain almost difficult to believe. But the Q4 guide, once you adjust for an extra week, implies a sharp sequential slowdown. Gross margins are guided down, forward supply commitments have climbed again, and customer-financing exposure is now large enough to quantify.
And then there’s something I never imagined we’d be discussing back in August: Jensen Huang is no longer NVIDIA’s CEO.
For me, this goes far beyond a change in leadership. Jensen wasn’t just the person running NVIDIA. He was its founder, its public face, its strategic vision and, in many ways, its soul.
I know NVIDIA is much bigger than one individual. It has extraordinary engineers, a deeply established ecosystem and a technology roadmap that doesn’t simply disappear when its CEO leaves.
But I can’t shake the feeling that something fundamental has changed. The business may have lost its most recognizable leader, but has it also lost the person who gave it its direction?
That’s a question no quarterly earnings report can answer, and one I’ll be watching just as carefully as the numbers.
First, the numbers
| Metric | Q3 FY26 | Q2 FY27 | Q3 FY27 | Q3 vs Q2 |
|---|---|---|---|---|
| Revenue | $57.0B | $96.2B | $115.8B | +20% |
| Data Center revenue | $51.2B | $89.0B | $107.6B | +21% |
| Hyperscale revenue | $35.1B | $48.7B | $60.1B | +23% |
| AI Clouds, Industrial & Enterprise (ACIE) | $16.1B | $40.3B | $47.5B | +18% |
| GAAP gross margin | 73.4% | 75.0% | 74.8% | −0.2 pts |
| GAAP operating expenses | $5.8B | $8.4B | $9.2B | +9% |
| GAAP operating income | $36.0B | $63.7B | $77.5B | +22% |
| GAAP net income | $31.9B | $59.7B | $65.3B | +9% |
| GAAP diluted EPS | $1.30 | $2.46 | $2.70 | +10% |
| Non-GAAP diluted EPS | $1.27 | $2.22 | $2.68 | +21% |
Source: NVIDIA Q3 results and Q3 CFO commentary. NVIDIA’s fiscal Q3 FY2027 ended on 25 October 2026. Percentages use the company’s published rounded comparisons.
Revenue rose 20% sequentially, but operating income rose 22%. Even at this scale, NVIDIA is still generating operating leverage. Using the unrounded financial statements, the GAAP operating margin comes to approximately 66.9%, up from roughly 66.2% in Q2. That is an extraordinary result for a hardware-heavy business in the middle of a product transition.
The 9% sequential increase in GAAP net income does not mean operations weakened. NVIDIA reported $7.77B of net gains from equity securities in Q2, mostly unrealized revaluations of public and private holdings. Q3 recorded $1.8B, with gains on listed investments partly offset by losses and impairments on private holdings. That swing of roughly $6B in non-operating gains is why net income grew less than half as fast as operating income. Source: NVIDIA Q2 FY2027 Form 10-Q.
Investment gains count in GAAP net income, but they say little about the profitability of selling AI infrastructure. For valuation, I look at operating income and free cash flow separately from investment revaluations.
Data Center has become even more dominant
Data Center revenue rose from $89.0B to $107.6B: an additional $18.6B in three months. It now accounts for approximately 92.9% of total revenue, versus 92.5% in Q2. Whatever NVIDIA becomes in robotics, PCs or edge AI, its financial results today are AI infrastructure results.
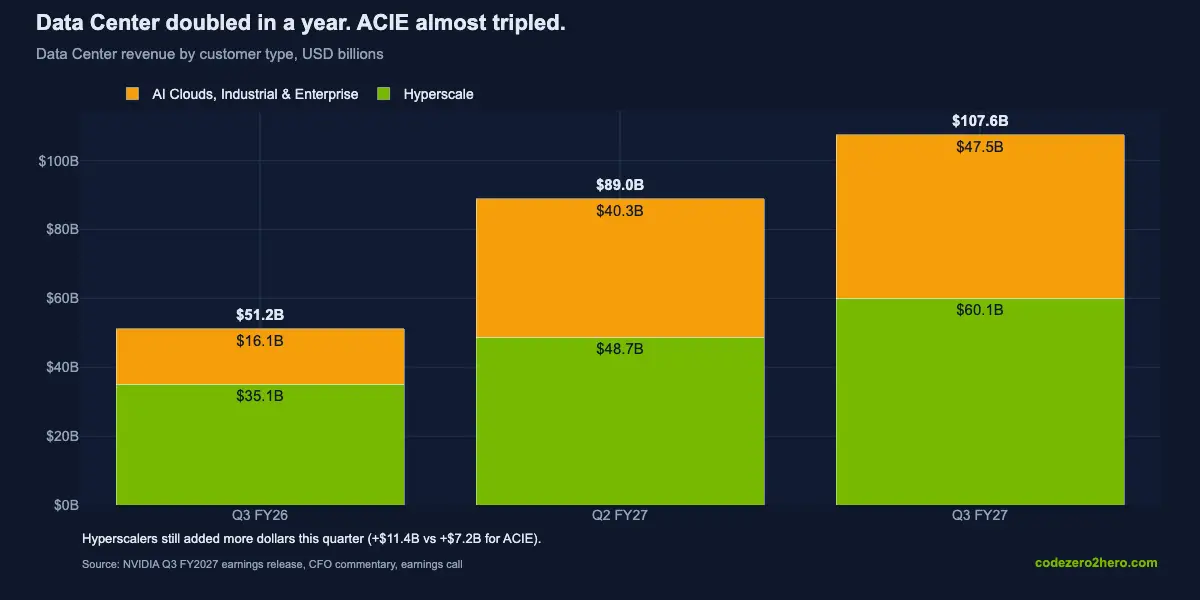
- Hyperscale: $60.1B, up 23% QoQ and 71% YoY.
- ACIE: $47.5B, up 18% QoQ and 195% YoY.
To make the distinction clearer, think of Hyperscale as the large cloud and technology platforms like Microsoft Azure, Amazon AWS, Google Cloud, Oracle Cloud Infrastructure and Meta.
AI Clouds, Industrial and Enterprise (ACIE) includes specialized AI infrastructure providers such as CoreWeave, Nebius, IREN, Nscale and Lambda, alongside enterprises, industrial customers and sovereign AI initiatives.
Both groups purchase NVIDIA infrastructure, often at enormous scale and the difference is primarily their business models, NOT the GPUs they buy. And there is an important distinction for my investment thesis: ACIE growth does not automatically mean independent end-demand growth. A specialized AI cloud may rely on outside financing and rent its GPUs to an AI lab, while a hyperscaler may serve that same lab through its own cloud infrastructure.
So Hyperscale versus ACIE tells me who is building the infrastructure, but not necessarily who ultimately pays for the compute, and that’s the distinction I want to follow when assessing circular-financing risk.
So back to main thread, the hyperscalers supplied the larger share of the increase this quarter (+$11.4B vs +$7.2B for ACIE). But ACIE is now nearly a $50B quarterly business that almost tripled in a year.
In Q2 I argued that the wider AI ecosystem was becoming a real second source of demand and Q3 numbers, strengthens that claim. It doesn’t tell us how much of the non-hyperscaler spending is supported by recurring revenue rather than capital raises and infrastructure financing, and that distinction matters more every quarter.
Cheaper tokens, more compute: a problem for the efficiency bear case
According to management, token prices have fallen nearly 60% since May, while OpenRouter’s weekly token volume increased 35-fold year over year and 3.5-fold in the last three months. At the same time, rental rates for some accelerators have risen: Hopper GPUs have been recontracted at up to twice their original price, and B300 rates are more than 60% above introductory levels. Source: Q3 earnings-call transcript.
The price of the finished AI service is falling while the rental price of the machinery producing it is rising.
That is, for now, an answer to the argument that more efficient models mean less demand for compute as efficiency lowers the cost of a task. It also makes new tasks economical: longer coding sessions, always-on assistants, agents working through business processes that previously didn’t pay and yeah, OpenRouter blog page informs us that “Agents consume 76% of all tokens”.
Two limits. One platform’s token growth is not the whole market, and NVIDIA’s rental-rate anecdotes are not an independent price index. The question which we should track is: as intelligence gets cheaper, does the volume of economically useful work expand even faster? Also, rising rental rates matter again, for a second reason, which I come back to in the margin section: someone in the chain is currently capturing that pricing, and this quarter, in my view, it was not NVIDIA.
The Moat Is Still There. But Its SOUL Is Gone.
Whether AMD can match NVIDIA’s software maturity, deployment experience and economics at scale remains to be demonstrated. But dismissing AMD as merely another GPU competitor would be a mistake.
And there is another factor I think investors shouldn’t underestimate: Jensen Huang is no longer there.
Jensen wasn’t just NVIDIA’s technological visionary. He was also a relationship builder, deeply involved in negotiating partnerships, securing manufacturing capacity and keeping NVIDIA’s enormous supply chain moving.
I genuinely believe those personal relationships mattered far more than most financial models can capture. All those meetings, dinners with suppliers and partners across Asia, and years spent building trust, I suspect they paid enormous dividends when the entire AI industry suddenly started fighting for the same manufacturing capacity.
And perhaps most importantly, there was no planned succession, no transition period, no gradual handover of responsibilities unlike Amazon, where Jeff Bezos stepped aside through an orderly leadership transition.
Jensen’s departure was abrupt, leaving NVIDIA to navigate one of the most demanding periods in its history without the person who had spent decades building those relationships. Of course, NVIDIA still has its engineers, its contracts, its ecosystem and an experienced leadership team. None of that disappears overnight.
But I’ve been thinking about something else. What happens to the culture of a company when the person who gave it its direction suddenly disappears?
Many of NVIDIA’s people have already accumulated considerable wealth. Money may no longer be the primary reason some of them come to work every morning. Perhaps what kept them pushing was the ambition, the engineering challenge, the belief that they were building something extraordinary together, the dream. I don’t know how much of that depended on Jensen personally. And I certainly don’t think NVIDIA’s engineers will suddenly stop innovating.
But money can retain talent. It cannot automatically replace a shared sense of purpose.
And relationships built over decades don’t automatically transfer with a CEO title either. With AMD building a credible alternative infrastructure stack, I wonder whether losing Jensen at this particular moment might eventually prove more consequential than the market expects.
Rubin moved from roadmap risk to execution risk
In Q2, the Blackwell-to-Rubin transition was the main execution risk I was watching. Architecture transitions are when companies get caught with the wrong inventory, delayed shipments or customers waiting for the next generation.
NVIDIA now says Vera Rubin NVL72 is shipping, with deployments or operating racks at CoreWeave, Google Cloud, Microsoft Azure, Oracle and Nebius. Management said Rubin generated nearly $20B of revenue in its first quarter of production shipments, and that major hyperscales partners brought it into production in about half the time Grace Blackwell took. Source: Q3 earnings-call transcript.
Those are management-reported metrics, but they say more about commercial execution than a launch date does. Ramp risk isn’t gone: production economics, availability and margins over the next few quarters still need to be seen. The platform is also widening: Vera CPUs, networking, DPUs, software, rack-scale reference designs and agent infrastructure. Networking revenue exceeded $21B in Q3. That is what full stack should mean in an investment thesis: a measurable revenue stream, not a slogan. A competitor now has to offer a complete alternative system at scale, with the software and operational maturity to match.
The right question remains who can offer a better AI infrastructure stack, and not anymore who can design a faster energy efficient GPU.
And AMD is getting closer to challenging NVIDIA on precisely those terms. With Helios, AMD is bringing together its Instinct GPUs, EPYC CPUs, Pensando networking and ROCm software into a complete rack-scale AI architecture.
I think this is where the competition becomes genuinely interesting. NVIDIA still benefits from a mature, deeply integrated software and hardware ecosystem, but AMD is no longer competing on accelerator specifications alone. It’s building an alternative infrastructure stack, with open standards and reduced vendor lock-in as part of the proposition.
The first number I don’t like: the Q4 guide, normalized
Management guided Q4 revenue to $130B ±3%, which comes about 12% above Q3 and two adjustments change that picture:
- Q4 has 14 weeks. Pro-rated to 13 weeks, the guide is about $120.7B, or +4% sequentially.
- The guide assumes no China Data Center compute revenue. Q3 included $2.4B of Hopper shipments to China. Against Q3 excluding China ($113.4B), the normalized guide is about +6%.
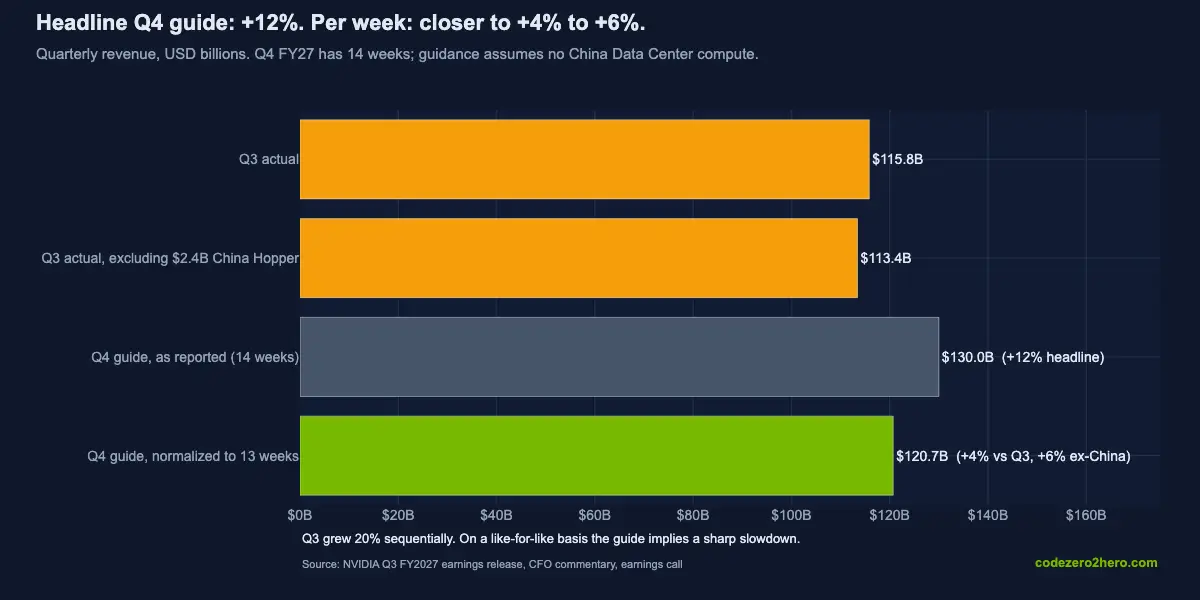
Pro-rating by weeks is crude, shipments are lumpy, and Rubin volume may be back-loaded. But it is the right first-pass comparison, and it says sequential growth slows from 20% to mid-single digits per week of selling. That sits awkwardly next to management raising its FY2028 revenue-growth outlook from about 70% to 75%. Both can be true if supply, not demand, is the constraint in Q4 and capacity steps up in FY2028 and that is the explanation to test next quarter.
The second number I don’t like: Q4 gross-margin guidance
Q3 GAAP gross margin was 74.8%, slightly below Q2’s 75.0%, which NVIDIA attributed partly to the initial Rubin ramp.
Q4 guidance is 71.0%–72.0%, a midpoint of 71.5%: a 3.3-point decline. At $130B of revenue, that is about $4.3B of quarterly gross profit.
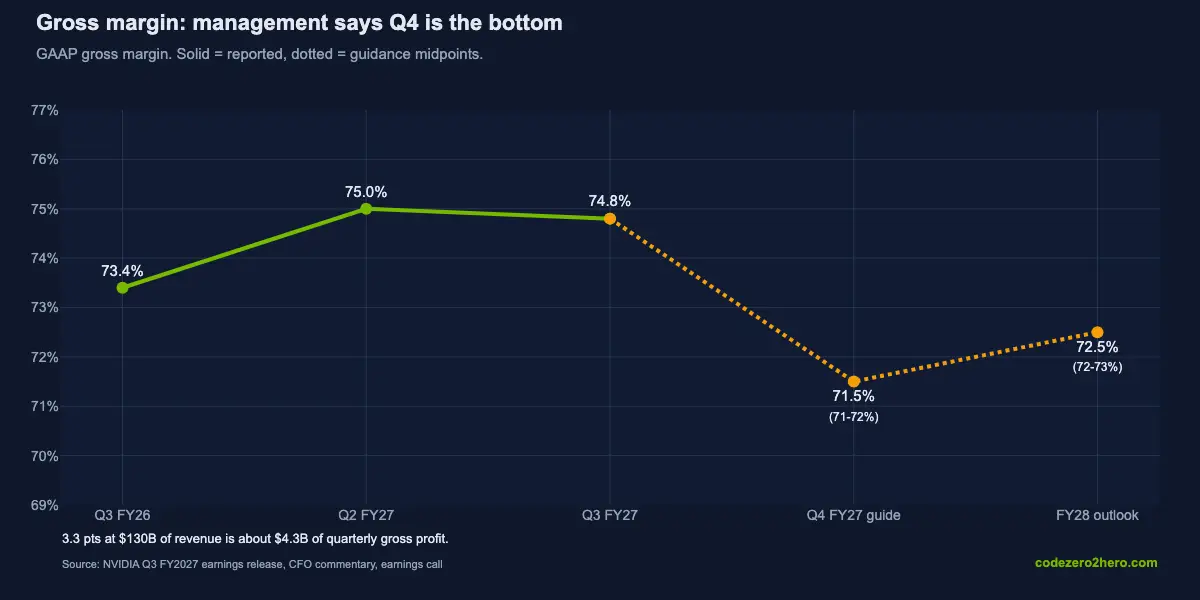
Management’s explanation is specific: NVIDIA absorbed higher supply costs while honoring existing customer purchase orders, and expects new pricing to restore margins. Kress called Q4 the expected bottom and reaffirmed a 72–73% gross-margin range for FY2028, consistent with last quarter’s outlook. Source: Q3 earnings-call Q&A.
Three pieces of this report fit that explanation together:
- Input costs are rising. The jump in supply commitments (next section) is mostly multi-year memory procurement.
- Downstream pricing is rising. Hopper and B300 rental rates are up, so cloud operators are capturing pricing NVIDIA locked in earlier at old contract prices.
- NVIDIA is between the two, paying new input prices while delivering at old selling prices.
If that reading is correct, the margin squeeze is a repricing lag and should reverse as new contracts roll over. If customers resist repricing because they now have credible alternatives, it is a loss of pricing power. The second is much more serious for the reverse DCF with 71.5% is not a broken thesis. It is a watch item with a testable explanation: do FY2028 margins land at 72–73%?
The third number I don’t like: $390B of supply commitments
NVIDIA’s supply and capacity commitments rose from $279B in Q2 to $390B in Q3, mostly from multi-year memory procurement. This is not debt or a cash expense due tomorrow, it is a schedule of future purchases. But it is a very large statement about the demand NVIDIA expects to fulfill, and $272B of it falls due within roughly 15 months.
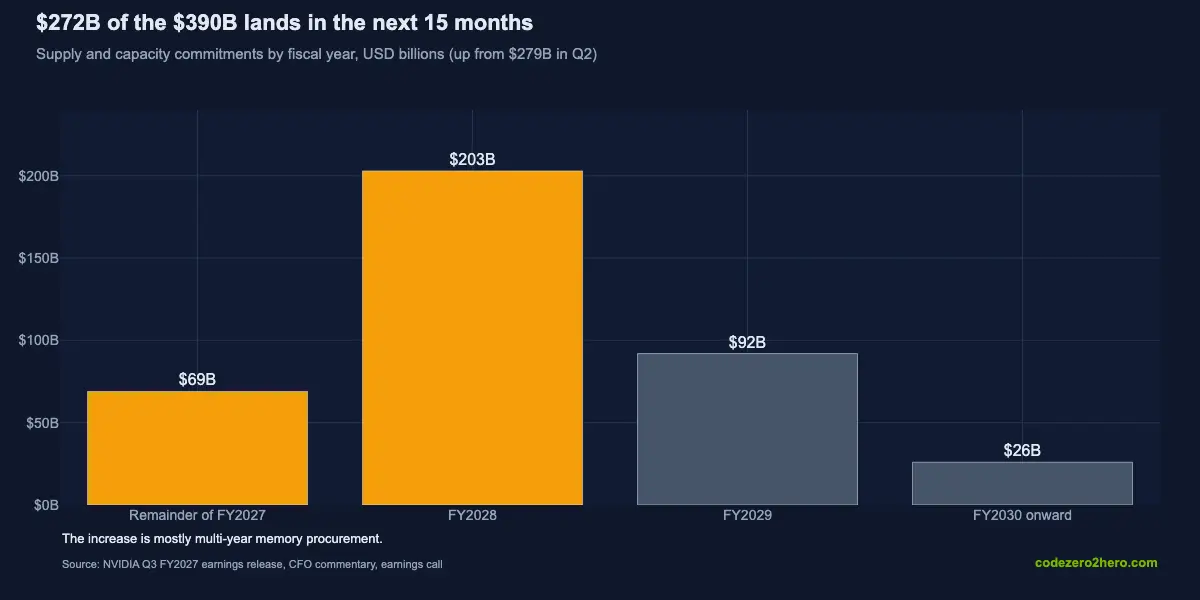
| Supply and capacity commitments | Amount |
|---|---|
| Remainder of FY2027 | $69B |
| FY2028 | $203B |
| FY2029 | $92B |
| FY2030 onward | $26B |
| Total | $390B |
Cloud-service agreements and data-center leases not yet commenced total another $102B, versus $74B a quarter earlier. NVIDIA also disclosed $20B of future equity-investment commitments and $32B in conditional neocloud agreements. These have different terms and conditions, so I won’t add them into one frightening total.
For scale: NVIDIA holds $53.5B of cash and marketable debt securities, and generated $43.8B of free cash flow in Q3 (about $175B annualized).
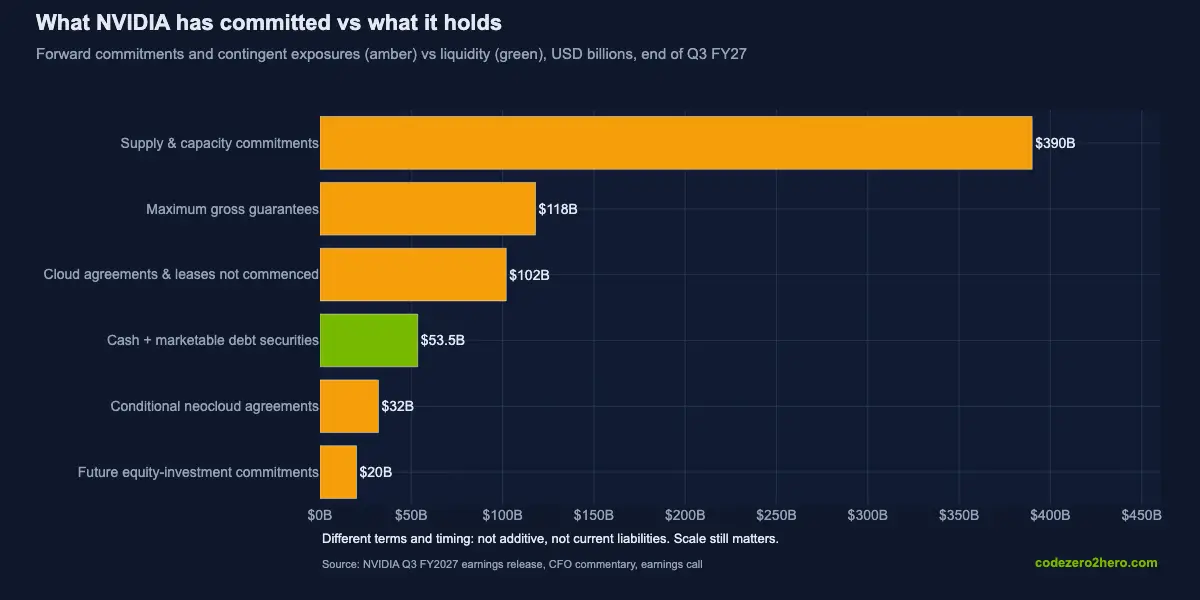
Current cash flow covers these commitments comfortably if revenue holds. The risk is not liquidity today, it is that commitments are fixed while demand is not, so a demand miss in FY2028 would hit a cost base already locked in.
Management also cited $2.5T of cloud-industry backlog, up from $2T three months earlier. That is an industry figure, not NVIDIA’s contracted orders. Source: Q3 earnings-call transcript.
Circular financing is no longer an abstract argument
This was the part of the Q2 article I most wanted to revisit. The question isn’t whether NVIDIA sells real hardware, we have the answer to this, it does. The question is where the cash ultimately comes from, and how much infrastructure spending depends on financing supplied or supported within the same ecosystem.
Q3 puts numbers on it. NVIDIA disclosed $118B of maximum gross guarantee exposure across land, power, shell and hardware-related arrangements. $105B of that relates to phase-by-phase guarantees for the SB Energy site in Ohio planned for OpenAI infrastructure. The first phase isn’t expected to become effective until FY2029, exposure builds as buildings become ready, and no guarantee payments have been made to date.
That is not a current loss or an immediate payment obligation. It is real contingent credit exposure: more than twice NVIDIA’s cash and securities, though below one year of FCF at the current rate. The CFO commentary also describes conditional neocloud arrangements where NVIDIA earns hardware revenue and, if criteria are met, may share in revenue from the neoclouds’ own customers. The chain looks like this:
NVIDIA designs and sells infrastructure
↓
NVIDIA helps selected participants secure financing, sites or credit support
↓
those participants build and operate capacity
↓
NVIDIA earns hardware revenue and potentially other economics
↓
the model ultimately depends on third-party customers paying enough for compute
None of this is improper, and it may be a smart way to address AI’s capital bottleneck. But the more of that chain NVIDIA is exposed to, the less GPU shipments alone prove that the end economics are healthy.
Are external customers generating enough real economic value from AI to sustain the infrastructure, financing and commitments built around it?
NVIDIA does not report what share of revenue comes from customers it supports through financing, that disclosure gap belongs on the dashboard.
The financing Q&A helped, partly
Bernstein’s Stacy Rasgon asked whether language making certain neocloud commitments conditional on customers first securing financing was a new practice or a new description of an old one.
Kress said certain guarantees only take effect once projects have secured the required equity or debt and are close to infrastructure readiness, and called the disclosure a clarification of existing policy. Allocation decisions consider land, power, completed facilities, financing readiness and credible offtake arrangements. Source: Q3 earnings-call Q&A.
So NVIDIA is not writing blank cheques, but financeable is not the same as profitable. Being financeable answers whether a data center can be built. Being economically productive answers whether it should have been.
Management also expects major frontier AI labs to contribute about 15% of FY2027 Data Center revenue. That is customer concentration, not a measure of NVIDIA-financed revenue. Source: Q3 earnings-call transcript.
Cash flow recovered, with a qualification
Q3 operating cash flow was $48.3B, up from $24.1B in Q2. Using disclosed capital/intangible purchases and principal payments, free cash flow was approximately $43.8B, a 37.8% FCF margin, up from roughly $21.3B (22.2%) in Q2.
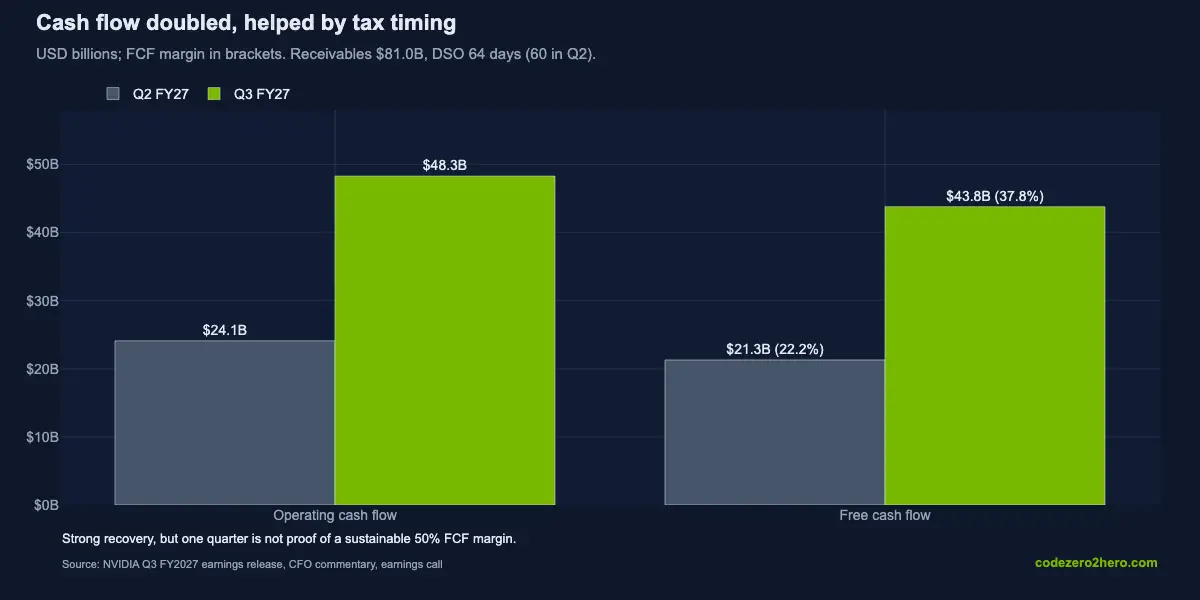
Part of the improvement was the timing of federal cash-tax payments. Working capital is also moving: receivables rose to $81.0B and inventory to $39.7B. Days sales outstanding rose from 60 to 64, which management attributed to Rubin shipment timing and extended payment terms for some large investment-grade customers. And that may be reasonable; tracking DSO is about noticing whether growth increasingly comes with slower collection. Strong cash generation, yes, but a stable 50% FCF margin, not yet.
The change the model can’t capture: Jensen Huang’s departure
Five days before the earnings release, NVIDIA announced that Jensen Huang had resigned as CEO, President and board member, effective immediately. Colette Kress became interim CEO while remaining CFO, and Harvey C. Jones became NVIDIA’s first board chair. NVIDIA’s 8-K gives no reason.
The context is public. Huang confirmed an affair with Alice Huang, an executive at Singapore-based Megaspeed, which is under investigation over alleged chip smuggling to China. The board said it was investigating whether he had been the target of a foreign intelligence effort. Reports of relationships with NVIDIA employees followed, and the board accepted his resignation unanimously. An SEC probe was reportedly opened on 17 November, and Huang is due to testify before House and Senate committees in 1st December. No wrongdoing by Huang has been established. Source: Forbes timeline.
On the call, the transition was closed rather than discussed. Jones said the board would not take questions on Huang and does not intend to reinstate him, despite Huang saying publicly the same day that he would be honored to return, and reports that some board members support a comeback. After that, the founder was absent from the call: I don’t recall Kress mentioning him by name once. On the succession, the only disclosure was that a search firm has been retained. No timeline, no criteria, no shortlist.
I understand why a board under legal and regulatory scrutiny would say as little as possible. But for investors, this is the least transparent part of the release. NVIDIA lost its founder, its architect-in-chief and its public face in one week, faces an SEC probe and congressional testimony, and gave shareholders a refusal to discuss it.
Much of NVIDIA’s architecture, product cadence, ecosystem strategy and execution culture is associated with Huang personally, as I said previously, in my view he was the soul of this firm. I can’t quantify his departure from one earnings release, and Q3’s Rubin shipments, revenue and guidance say the operating engine is still running. But leadership continuity and regulatory exposure are now their own risk category. The CEO search, strategy continuity, the SEC probe, the congressional testimony and the quality of management communication all matter more than they did in August and a discount-rate input does not capture this.
Reverse DCF: the price changed as much as the business
In the Q2 article, I asked what a roughly $5T enterprise valuation required. NVIDIA closed at $209.66 on 26 August 2026 and at $155.46 on 17 November, a decline of about 25.9%, while the company kept reporting extraordinary operating growth. Source: NVDA historical prices
I don’t think there is one explanation. Investors have been reassessing AI infrastructure valuations, the durability of spending, customer-financing exposure, gross-margin pressure and competition from custom silicon, and fear and greed played their part too. More recently, Jensen Huang’s abrupt departure added governance and execution uncertainty. I can’t separate these influences or prove how much each contributed.
The distinction matters for valuation. A falling share price does not necessarily mean the business is deteriorating. It can also mean investors want a bigger margin of safety, are paying lower multiples for future earnings, or are less confident in the assumptions behind the previous valuation. That is why I rerun the reverse DCF rather than read the price decline itself as evidence that the business is worth less.
Enterprise value
NVIDIA’s Q3 balance sheet reports $32.371B of long-term debt, no short-term debt, $29.089B of cash and equivalents and $ 24.423B of marketable debt securities: about $21.1B of net cash.
| EV calculation | Approximate value |
|---|---|
| Share price (17 Nov 2026 close) | $155.46 |
| Shares (rounded, weighted-average basic count as proxy) | 24.1B |
| Equity market capitalization | $3,746.6B |
| Add: financial debt | +$32.4B |
| Less: cash and equivalents | −$29.1B |
| Less: marketable debt securities | −$24.4B |
| Enterprise value | $3,725.5B (~$3.73T) |
Three deliberate choices: strategic equity investments are not deducted as cash, operating leases are not added, and the share count is rounded. The goal is to value the operating business; investments and other financial exposures are assessed separately. Data providers using other share-count conventions will show slightly different market caps. This is a pre-earnings snapshot, not a live quote. Source: NVIDIA Q3 financial statements
For comparability with Q2, I kept the same simplified structure:
Implied five-year revenue CAGR
| Sustainable FCF margin | Start: Q3 actual ($463.4B) | Start: Q4 guide, normalized ($482.9B) | Terminal value share of EV |
|---|---|---|---|
| 35% | 8.2% | 7.2% | 78–79% |
| 40% | 5.0% | 4.1% | 77–78% |
| 45% | 2.3% | 1.4% | 76–77% |
| 50% | 0.0% | −0.9% | 75–76% |
Calculated with a five-year constant-growth, constant-FCF-margin model and Gordon-growth terminal value. Model outputs, not forecasts or price targets.
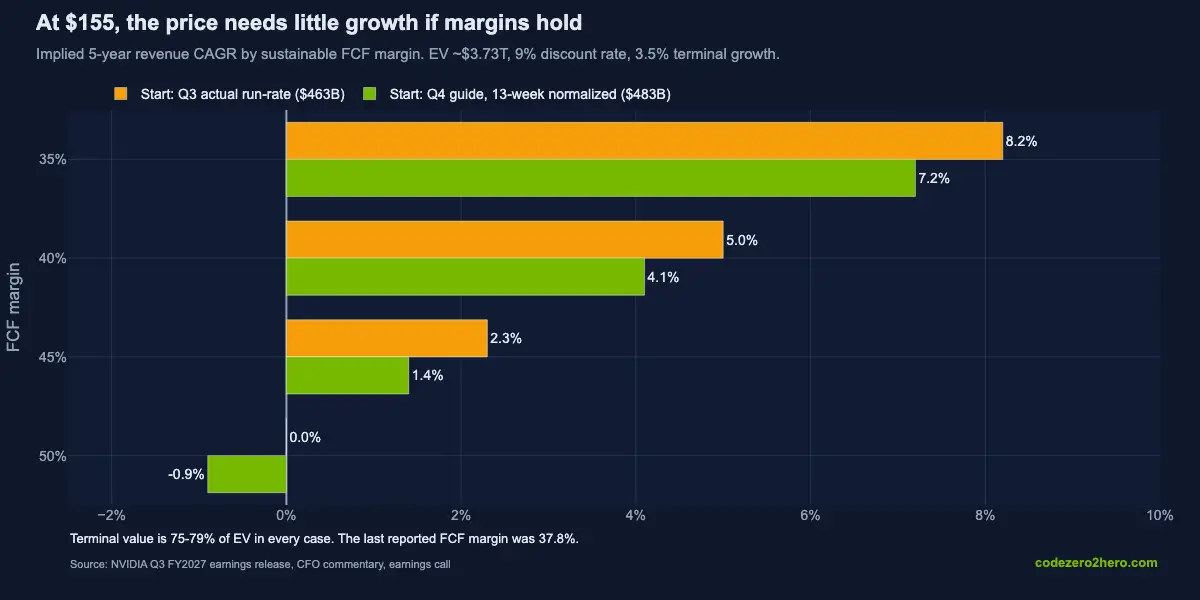
The reversal from Q2 is striking. At a lower price and a higher revenue base, the market now requires little growth if high free-cash-flow margins persist.
Two catches:
- Terminal value is 75–79% of the valuation in every case. The answer depends mostly on what happens after year five, at margins NVIDIA has to sustain for a decade or more.
- The last reported FCF margin was 37.8%, not 50%, and gross margin is guided down next quarter. At 35–40% margins, the price requires 4–8% annual revenue growth for five years. Demanding? No. Free? Also, no.
The stock is not clearly cheap on this model alone. The price is less demanding than in August, while the durability of long-term margins deserves more scrutiny.
My five-category NVIDIA thesis dashboard: Q3 update
This is the part I intend to reuse every quarter: an evidence trail of what is changing, not a score. The vs Q2 column marks the direction of each indicator for the thesis: ↑ stronger, → unchanged, ↓ weaker, ⚠ new item.
1. Demand: improving, but still concentrated
| Indicator | Q3 evidence | vs Q2 | My reading |
|---|---|---|---|
| Data Center | $107.6B, +21% QoQ | ↑ | Demand momentum strengthened |
| Hyperscale | $60.1B, +23% QoQ | ↑ | Largest contributors remain important |
| ACIE | $47.5B, +18% QoQ | ↑ | Non-hyperscale demand continues expanding |
| Q4 guide | $130B ±3%; ~+4% QoQ per 13 weeks; ~+6% ex-China | ↓ | Sharp like-for-like slowdown; test whether supply-limited |
| FY2028 growth outlook | Raised to ~75% from ~70% | ↑ | Stronger management visibility; not contracted revenue |
| Token economics vs utilization | Token prices ~−60% since May; OpenRouter 35× YoY; some GPU rental rates higher |
⚠ | Tests demand elasticity; limited platform coverage |
| End-customer monetization | No consolidated measure | → | Still a key gap |
I still want to compare NVIDIA’s claims with hyperscaler capex, enterprise AI revenues and neocloud economics. NVIDIA’s revenue is not a substitute for any of the three.
2. Profitability: strong actuals, margin warning ahead
| Indicator | Q3 evidence | vs Q2 | My reading |
|---|---|---|---|
| GAAP gross margin | 74.8%, −0.2 pts QoQ | → | Holding up during Rubin ramp |
| GAAP operating margin | ~66.9% vs ~66.2% | ↑ | Exceptional operating leverage |
| FCF margin | ~37.8% vs ~22.2% | ↑ | Recovered, partly tax-timing |
| Q4 gross-margin guide | 71.0–72.0% | ↓ | Watch closely |
| FY2028 gross-margin outlook | 72–73%; Q4 expected to be the bottom | → | Test the input-cost/repricing explanation |
| Investments and GAAP EPS | $1.8B net equity gains | → | Keep operating and investment returns separate |
3. Supply and balance sheet: commitment risk rising
| Indicator | Q3 evidence | vs Q2 | My reading |
|---|---|---|---|
| Inventory | $39.7B vs $31.6B | ↓ | Consistent with Rubin ramp, but growing |
| Receivables | $81.0B; DSO 64 vs 60 | ↓ | Collection speed deserves attention |
| Supply/capacity commitments | $390B vs $279B; $272B due within ~15 months | ↓ | Much greater forward exposure |
| Cloud agreements + future leases | $102B vs $74B | ↓ | Infrastructure commitments rising |
| Cash + marketable debt securities | $53.5B | → | Ample liquidity at current FCF |
Supply constraints can support revenue today and create more downside if the capital cycle turns, both can be true at once.
4. Financing and circularity: exposure clearer, end-demand still opaque
| Indicator | Q3 evidence | vs Q2 | My reading |
|---|---|---|---|
| Maximum gross guarantees | $118B (~2.2× cash and securities) | ⚠ | Contingent, not a current loss |
| SB Energy / OpenAI guarantee | Up to $105B, phased, from FY2029 | ⚠ | Multi-year potential credit exposure |
| Conditional neocloud agreements | $32B future schedule | ⚠ | Terms matter; not guaranteed spend |
| Equity-investment commitments | $20B future schedule | → | Continuing ecosystem investment |
| Revenue from NVIDIA-supported counterparties | Not quantified | → | Critical disclosure gap |
| Frontier AI-lab concentration | ~15% of FY2027 Data Center revenue | ⚠ | Customer concentration, not financing exposure |
| Financing prerequisites | Guarantees conditional on funding and site readiness | ↑ | Watch when guarantees become effective |
This was my central concern in August, and I’m afraid, Q3 didn’t settle it. It showed that the financing links are economically significant, while the end-customer cash-flow question stays open.
5. Moat, competition and execution: product thesis stronger, leadership risk new
| Indicator | Q3 evidence | vs Q2 | My reading |
|---|---|---|---|
| Vera Rubin NVL72 | ~$20B first-quarter production revenue; major deployments |
↑ | Stronger commercial evidence, management-reported |
| Networking | More than $21B in Q3 | ↑ | Measurable full-stack revenue |
| Full-stack architecture | Vera CPUs, networking, DPU, rack-scale | ↑ | Moving beyond a GPU sale |
| Custom silicon / competitors | Threat remains | → | Watch deployments and economics, not press releases |
| System margins | Q4 margin guide down | ↓ | System economics need watching |
| Leadership continuity | Huang resigned; Kress interim CEO | ⚠ | Material new uncertainty |
The moat did not disappear with its founder. A leadership transition this consequential is still not irrelevant.
What would make me change the thesis?
My earlier kill criteria still apply: multiple quarters of weak Data Center sequential growth, sustained gross margins well below historical levels, working capital consistently outgrowing sales, major Rubin execution failures and meaningful customer substitution toward other platforms.
Q3 adds four specific checks.
First: the like-for-like slowdown. If Q4 lands near the guide, normalized sequential growth falls to mid-single digits. I want Q1 FY2028 to show whether that was a supply constraint that clears, or the start of a demand plateau. A raised FY2028 outlook only works with re-acceleration.
Second: margins. Q4 and FY2028 gross margins will show whether 71–72% is a repricing lag or structural compression. Management’s 72–73% FY2028 outlook is the checkpoint.
Third: financing. Commitments, receivables, DSO and customer-supported financing should remain explainable by independently durable demand, not by the next funding round.
Fourth: leadership. The transition should not interrupt NVIDIA’s product cadence, architecture strategy or execution culture. Rubin deliveries over the next two quarters are the test.
The bear case is not “NVIDIA stops growing.” The stronger bear case remains that AI infrastructure grows faster than its customers’ economic returns, so financing tightens and several parts of the system reprice at once.
The bull case is still alive: cheaper intelligence creates far more demand for tokens, agents, inference and compute than efficiency saves, while NVIDIA captures a large share of the stack.
I don’t know which path wins, that’s why I want numbers and conditions, not a story that always explains why I was right.
What changed, in one paragraph
Since Q2, the operating business has grown again, Rubin produced nearly $20B in its first production quarter, networking exceeds $21B, and management raised its FY2028 growth outlook, while the price investors pay has fallen about 25%. But the Q4 guide implies only ~4–6% like-for-like sequential growth, gross margins are guided down 3.3 points, forward supply commitments rose by $111B, guarantee exposure is now quantified at $118B, and the founder-CEO has left. Some guarantees are conditional on project financing, which helps, but the end-demand question remains open. The reverse DCF is easier to satisfy at a lower price, yet three-quarters of the value still sits in margins NVIDIA must earn after year five.
That is what I mean by what changed, not “the stock moved after earnings”, neither “the company beat by a few billion.”
Which assumptions became stronger? Which became weaker? And what would I need to see next quarter to change my mind?
Sources and methodology
Primary sources:
- NVIDIA Q3 FY2027 earnings release, 17 November 2026
- NVIDIA Q3 FY2027 CFO commentary, SEC exhibit
- NVIDIA Q3 FY2027 supplemental financial statements, investor relations PDF
- NVIDIA CEO transition announcement, 12 November 2026
- NVIDIA Q2 FY2027 earnings release
- NVDA historical closing prices (17 November 2026)
- NVIDIA Q3 FY2027 earnings-call transcript, 17 November 2026: management commentary and analyst Q&A on demand elasticity, Rubin, networking, FY2028 outlook, margins and financing.
Q4 normalization: $130B × 13/14 = $120.7B. This assumes revenue accrues evenly by week, which is a simplification; it is used only to make the sequential comparison like-for-like.
Reverse DCF: constant annual revenue CAGR for five years, constant FCF margin, a 9% discount rate and 3.5% perpetual growth, solved for the CAGR that matches enterprise value. Terminal value is 75–79% of EV across all scenarios, so small changes in discount rate, margin and terminal assumptions have large effects. A full intrinsic-value model would need year-by-year cash flows, share dilution (including stock-based compensation), capital needs and explicit treatment of contingent obligations. The Q3 Form 10-Q had not been filed when NVIDIA published its CFO commentary, so this article uses the supplemental financial statements and SEC-furnished earnings exhibits.
Charts were generated with Plotly from the figures above; the script is at github.com/codezero2hero/scripts.
For continuity, the prior article is NVIDIA Q2 FY2027: The Numbers Are Getting Hard to Comprehend. This is the next entry in the same quarterly research chain.
This is my research and interpretation of publicly available information, not investment advice. I am a student of this, learning in public. Figures and valuation assumptions are dated; future outcomes may differ materially.
Comments
0